Snow cover and snow depth are important climatic parameters in the boreal zone. Besides their relevance as climate change indicators, they play important roles in regional forest ecology, agriculture and water management.
ACHIM DREBS, JUHA KERSALO
Finnish Meteorological Institute
Up to 19 additional snow measurements were made in a 14-year period around the 15th of March on two successive days. The measurements stood in the tradition of a one hundred year observation series, where hundreds of snow depth (SD) and snow water equivalent (SWE) measurements were conducted by volunteers to amend the official snow cover observations provided by FMI and its predecessors (Solantie, 2000). The snowpack measurements were made with a yardstick, SWE was measured using a scale.
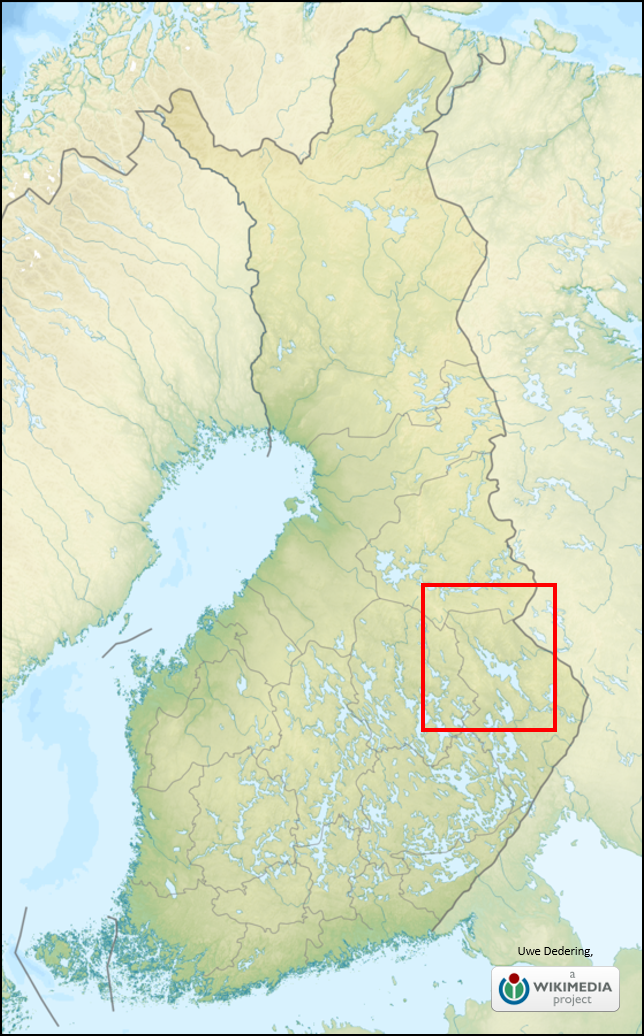
The measuring sites were categorized by three different properties. First, the sites were divided topographically in lower sites (8 sites, heights between 110–180 a.m.s.l.) and upper sites (11 sites, heights between 210–260 a.m.s.l.). Second, sites were divided in open spaces (field or meadow, less than 30 trees/ha, 9 sites), half-open spaces (swamp, bog, and open courtyards, 30–150 trees/ha, 6 sites) and sheltered space (pine forest, more than 150 trees/ha, 5 sites). The third property reflects the roughness of the sites in even (9 sites) and uneven (11 sites). This classification leads to higher scattering of the measurements results for uneven sites. All sites were documented with maps and areal pictures. The area of the measuring sites is shown in Fig. 1.
Concerning the snow depth and the SWE on the 15th of March, five winters out of the 14-year period can be regarded as snow-rich winters, eight as average winters, and two as winters with little snow.
Among other climatic factors like mean air temperature and precipitation, the snow depth and snow water equivalent depend on the prevailing wind conditions during the cold season (Solantie and Drebs, 2001).
The additional measurements were analyzed graphically and statistically. Results showed that with no exception, SD and SWE at upper measuring sites were greater than at lower measuring sites. Furthermore, snow quantities at lower sites remained more or less constant, while they increased at higher elevations (Fig. 2).
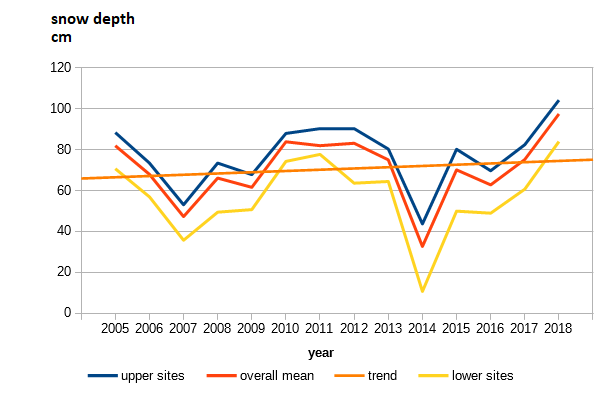
(blue: 11 upper sites; red: overall mean; orange: linear trend of the overall mean; yellow: 8 lower sites).
The snowiest areas in the examined region were the Maanselkä-Naulavaara area, the area at the Kuhmo-Nurmes regional administrative border, the Lieksa-Kivivaara area at the state border to Russia, and the Karjalanselkä at the Kaavi-Juuka region. Here, snow cover with more than 80 cm depth was observed. The less snowy areas covered almost the whole Lake Pielinen district between Valtimo and Lieksa, especially the easterly shorelines of Lake Pielinen, snow depth values peaked at 50 cm. The analysis of SWE revealed an increase of 30–40mm during the observation period.
References
Solantie, R., 2000: Snow depth on January 15th and March 15th in Finland 1919-98, and its implications for soil frost and forest ecology. Meteorological Publication, 42, Finnish Meteorological Institute, ISBN 951-697-520-8
Solantie, R., Drebs, A., 2001: Lumensyvyys ja Lumipeitteen vesiarvo 15.3. joulu-maaliskuun keskilämpötilan ja geostrofisten lounais- ja kaakkoistuulien erotuksen funktiona (in Finnish with a summary in English). Meteorological Publication, 45, Finnish Meteorological Institute, ISBN 951-697-541-0
Header image: Pixabay
HOW TO CITE THIS ARTICLE:
Drebs A., and Kersalo J., 2019: 14 years of extended snow depth and snow water equivalent measurements in eastern parts of Finland, FMI’s Climate Bulletin: Research Letters, 1(2), 8, DOI: 10.35614/ISSN-2341-6408-IK-2019-17-RL
CITATION INFORMATION:
Authors: Achim Drebs and Juha Kersalo
Received: September 10, 2019
Accepted: December 13, 2019
First online: December 19, 2019
Journal: FMI’s Climate Bulletin: Research Letters
Volume: 1
Issue: 2
Page: 8
DOI: 10.35614/ISSN-2341-6408-IK-2019-17-RL