We investigate the evolution of the large-scale weather patterns prior to the 40 most intense thunderstorm days in Finland in 2002–2021 by using lightning observations and the ERA5 reanalysis data. Our results show that intense thunderstorm days are typically associated with a surface high pressure to east and low pressure to west of Finland. An upper-level ridge is co-located with a warm and moist airmass over Fennoscandia. The large-scale weather pattern is largely similar for the three preceding days, however, large case-to-case variability occurs three days before the intense thunderstorm day.
MERI VIRMAN, TERHI K. LAURILA, HILPPA GREGOW
Finnish Meteorological Institute
In Finland, thunderstorms can be associated with numerous hazards, such as fallen trees, flooding and forest fires. To reduce the societal and economic impacts posed by thunderstorms, accurate weather forecasts are needed. Identification of the typical large-scale weather evolution associated with thunderstorms can aid forecasting the risk and preparing for the possible impacts some days in advance. This study aims to complement the existing knowledge of the large-scale weather conditions conducive to thunderstorm occurrence in Finland.
The mean large-scale environment on days with mesoscale convective systems (MCS) and smaller thunderstorms in Finland has been investigated previously by Punkka and Bister (2015) using radar and the NCEP/NCAR reanalysis data. However, that study covered only eight warm seasons and did not show how the environment varied between cases or evolved over time. In our study, we investigate the composite large-scale weather patterns, and their variability, on and before the most intense thunderstorm days in Finland and focus on a 20-year time period in 2002–2021.
We use lightning observations to find the most intense thunderstorm days between May and September. An intense thunderstorm day is defined to be a day when at least 10 000 cloud-to-ground lightning flashes are detected in Finland. In 2002–2021, we have had 40 of such cases. For these cases we assess the mean, median and standard deviation composites of selected meteorological variables calculated from the ERA5 data (Hersbach et al. 2020) at 12 UTC on intense thunderstorm days (day 0) as well as on the three preceding days (day -1, -2, and -3).
Our results show that an intense thunderstorm day occurs, on average, twice a year. Considerable variability occurs in the annual and monthly number of cases (not shown), which is also seen in the long-term time series of thunderstorm occurrence in Finland (Laurila and Mäkelä, 2019). The highest annual number of intense thunderstorm days occurred in 2003 (9 days), whereas there were 5 years when no intense thunderstorm days were detected. Roughly half of the cases occurred in July (21 days), whereas the number of intense thunderstorm days in May, June and August were 2, 9 and 8, respectively. None of the intense thunderstorm days occurred in September.
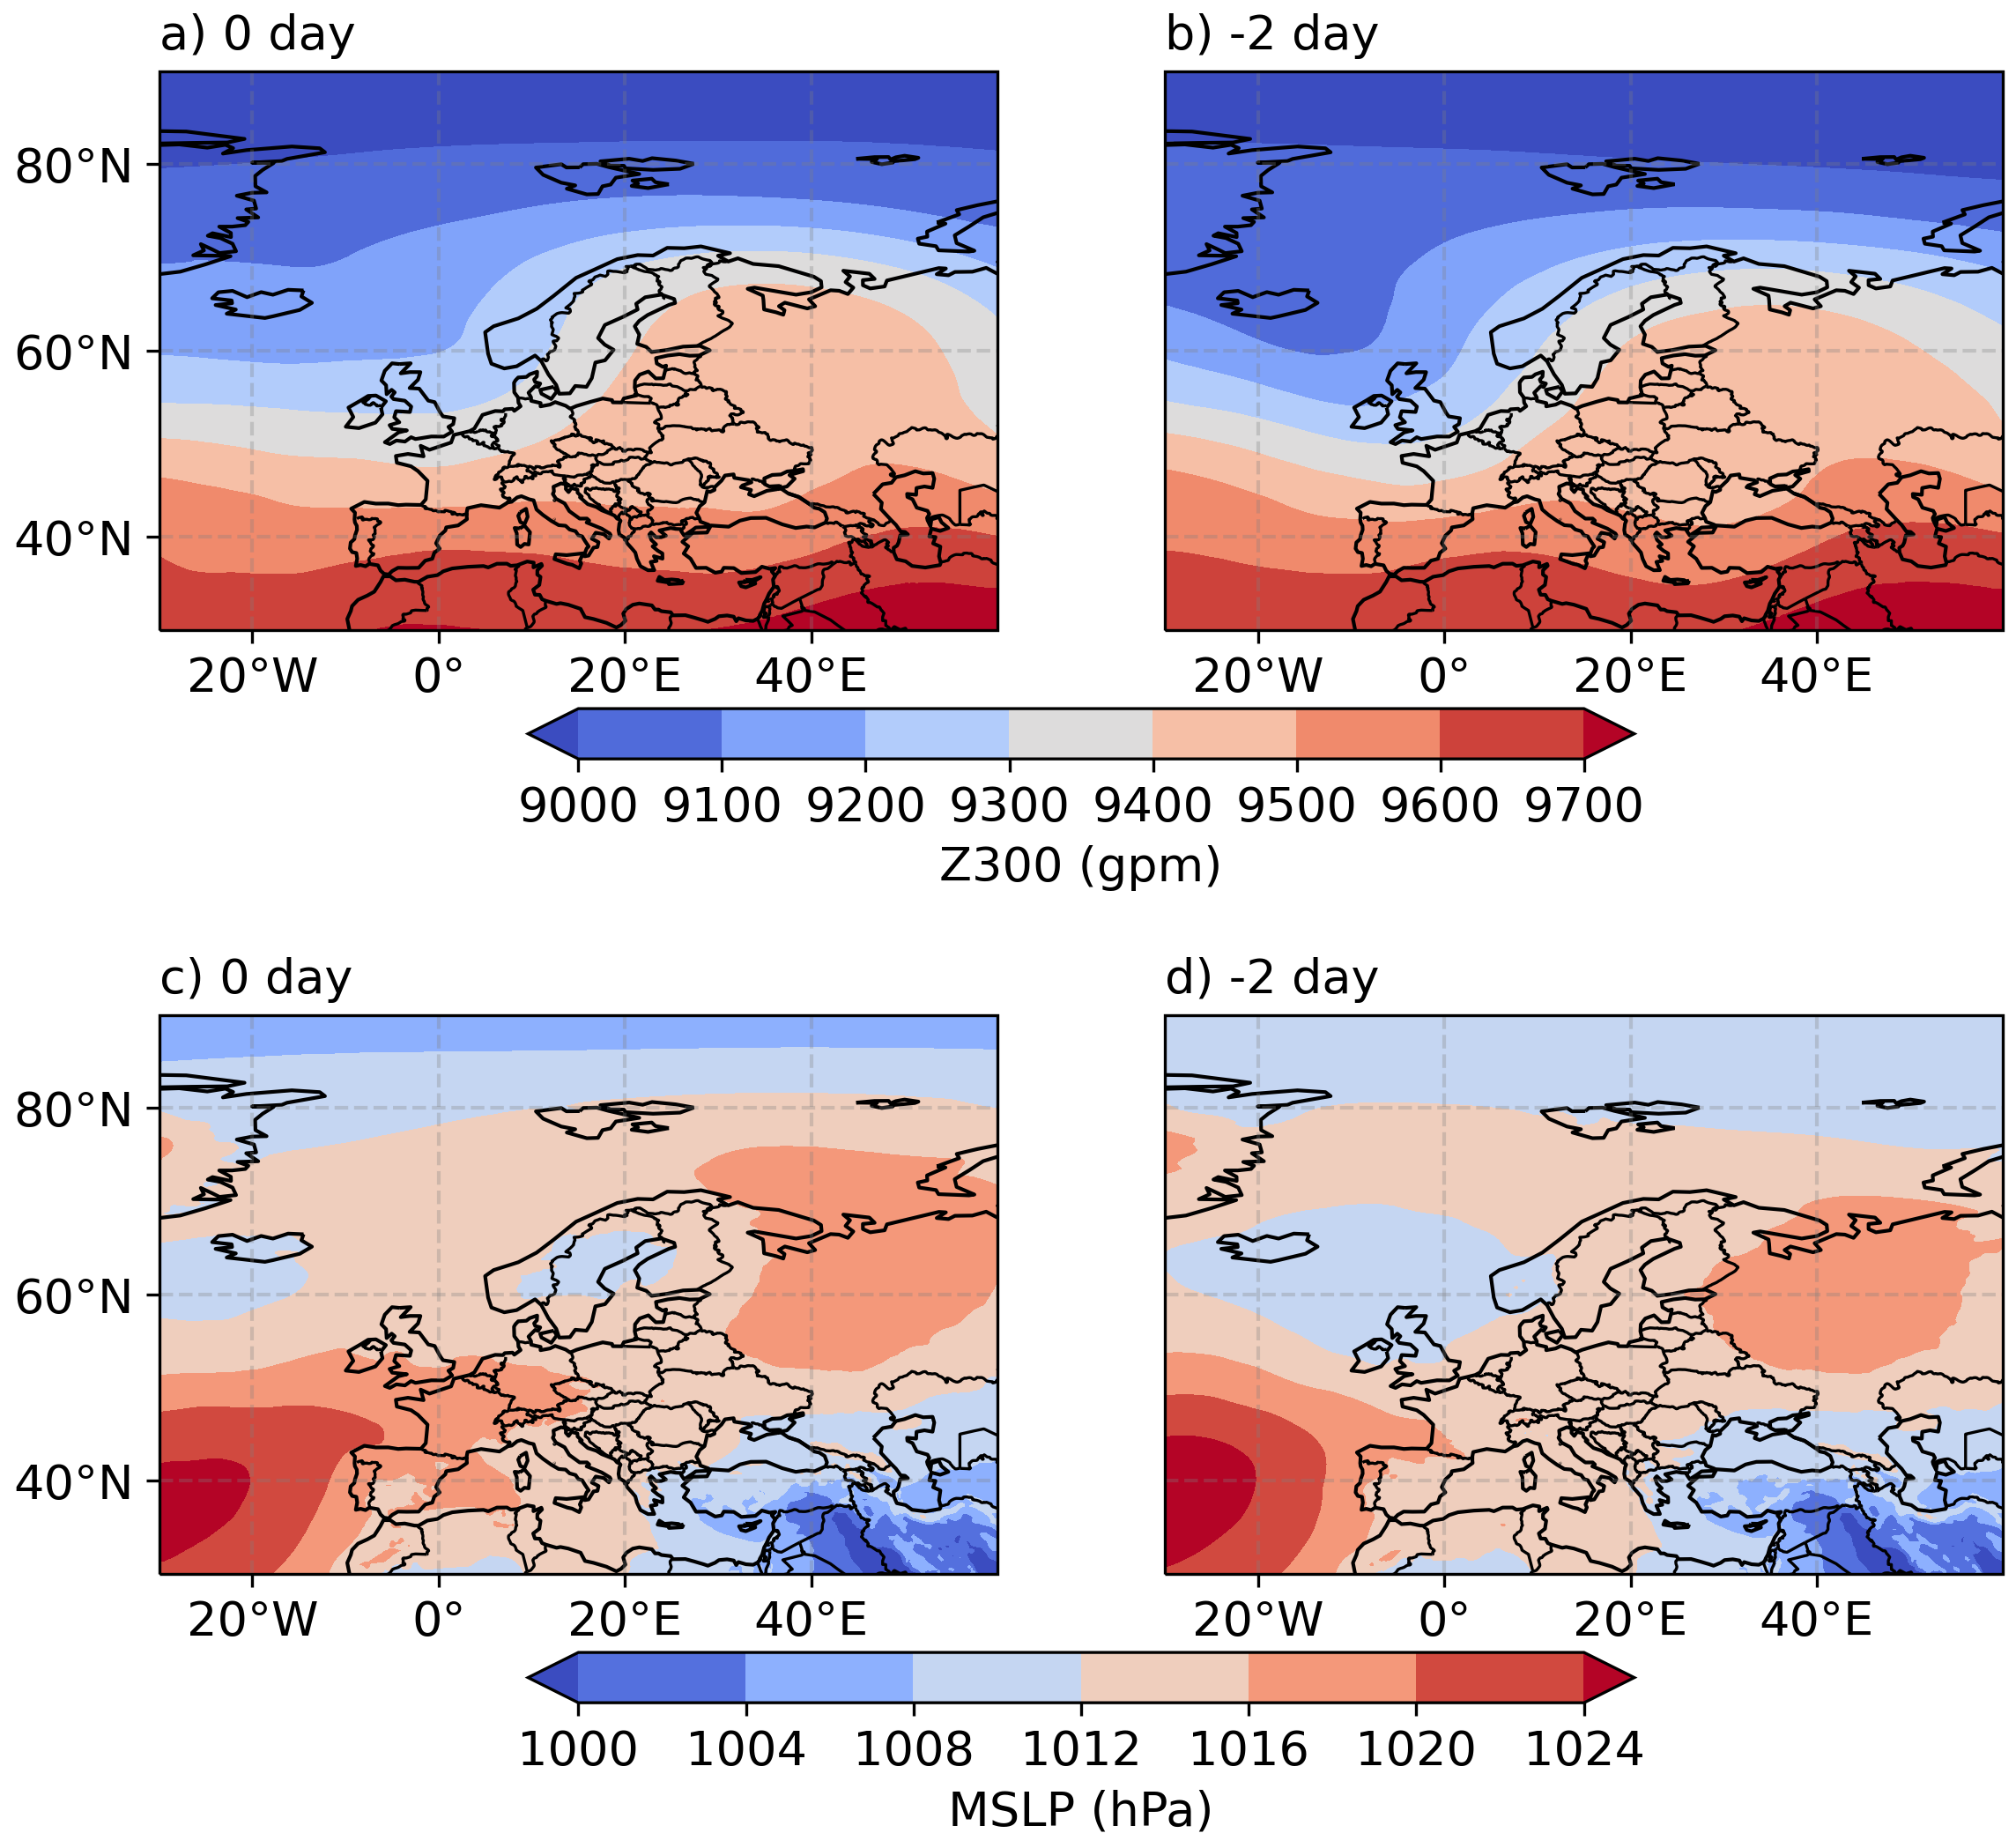
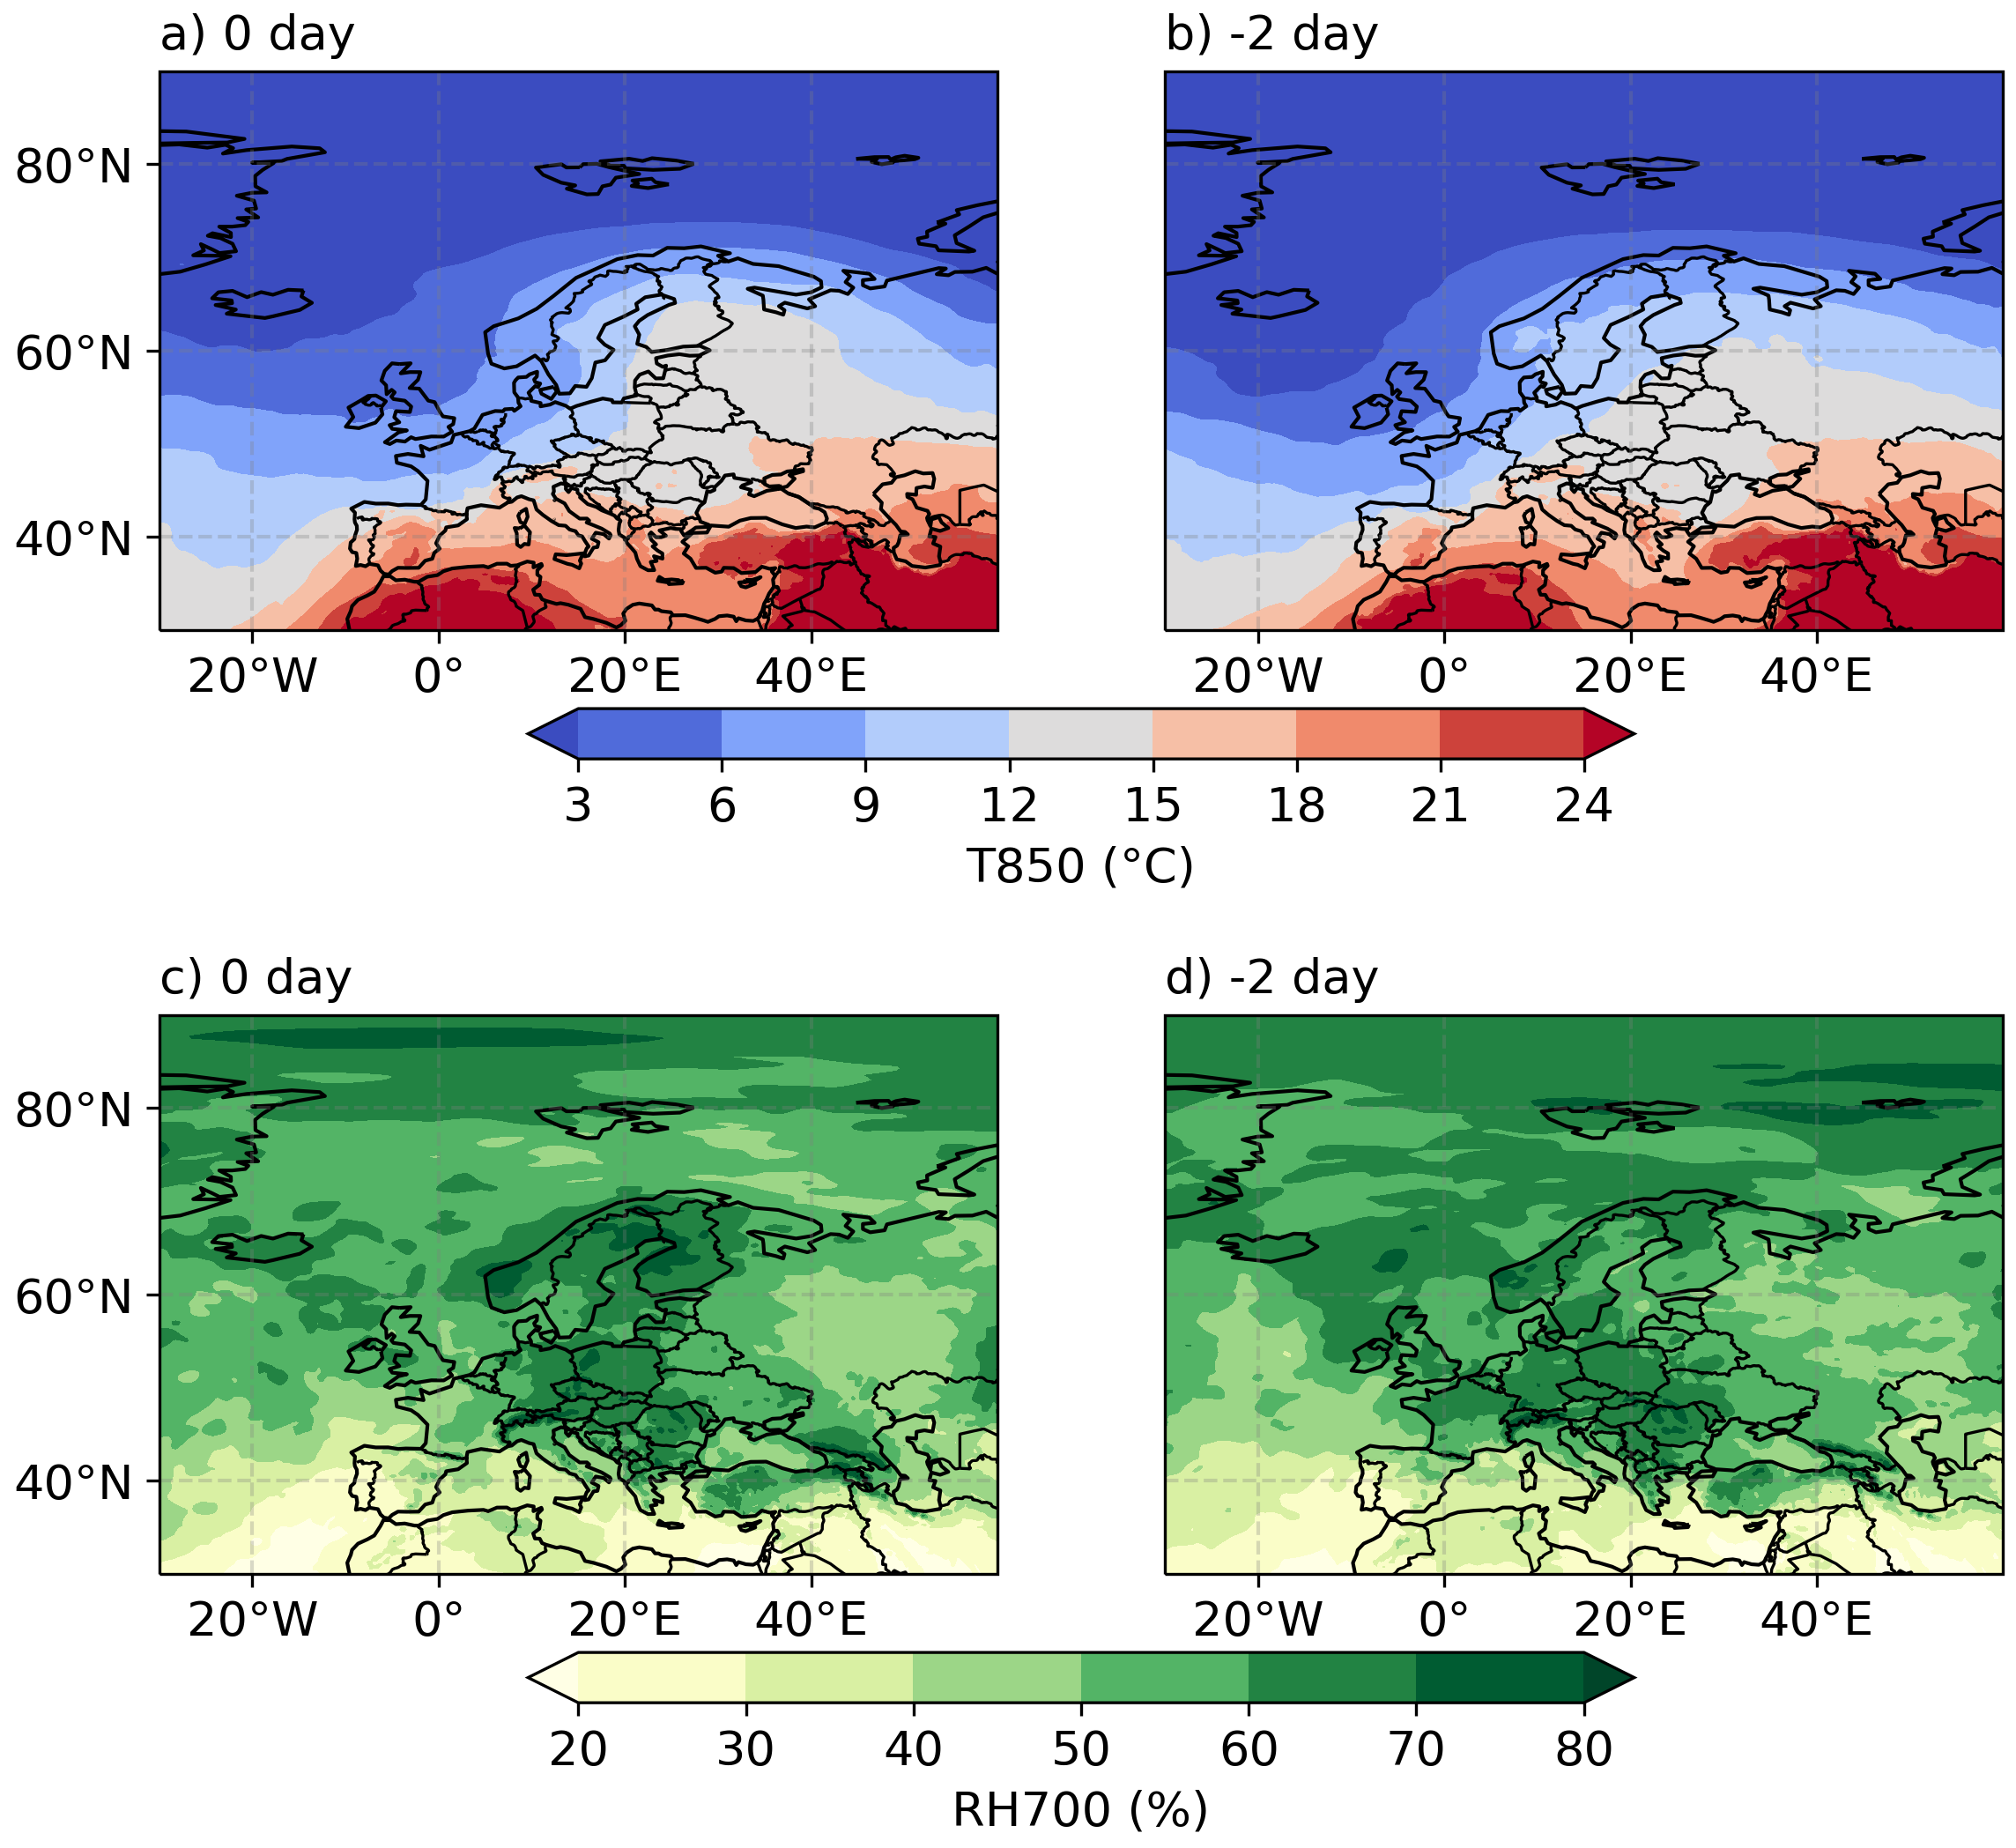
The composite mean 300-hPa geopotential height shows that on day 0, there is an upper-level ridge over eastern Fennoscandia and an upper-level trough over north-western Europe (Fig. 1a). At the surface, a high-pressure area is located over parts of western Russia, whereas an area of relatively low pressure occurs over Fennoscandia and another one close to Iceland (Fig. 1c). This kind of pattern would trigger a southerly flow over Finland and, thus, an inflow of warm and moist air from the south towards Finland. At the 850-hPa level, warm air from southern Europe extends to Fennoscandia, whereas over western Europe the airmass is colder (Fig. 2a). Relative humidity at 700-hPa is high over Fennoscandia and central Europe (Fig. 2c). The composite large-scale weather pattern somewhat resembles that associated with observed MCSs in Finland in a previous study (Punkka and Bister, 2015). More specifically, Punkka and Bister (2015) showed that MCSs are associated with an upper-level trough over western Europe and a surface low pressure area over Fennoscandia. Lastly, the composite mean fields (Figs. 1 and 2) in this study closely resemble the corresponding median fields (not shown).
On day 0, standard deviations of the 300-hPa geopotential height and the 850-hPa temperature are relatively small over Fennoscandia but larger over parts of western Russia and western Europe (Fig. 3a and Fig. 4a). This may suggest that intense thunderstorm days in Finland are typically associated with a ridge of warm airmass over Fennoscandia, but that there is large case-to-case variability in the zonal extent of the warm airmass, particularly to the east of Finland. The standard deviation of the mean sea level pressure on day 0 is relatively small in southern Europe and Russia, but relatively large over northern and western Europe and Iceland (Fig. 3c). This is expected, as mid-latitude cyclone activity in Europe is highest in these regions (Priestley et al. 2020). Standard deviation of the 700-hPa relative humidity shows large spatial variability (Fig. 4c), however, a distinct minimum is seen in the southern half of Finland.
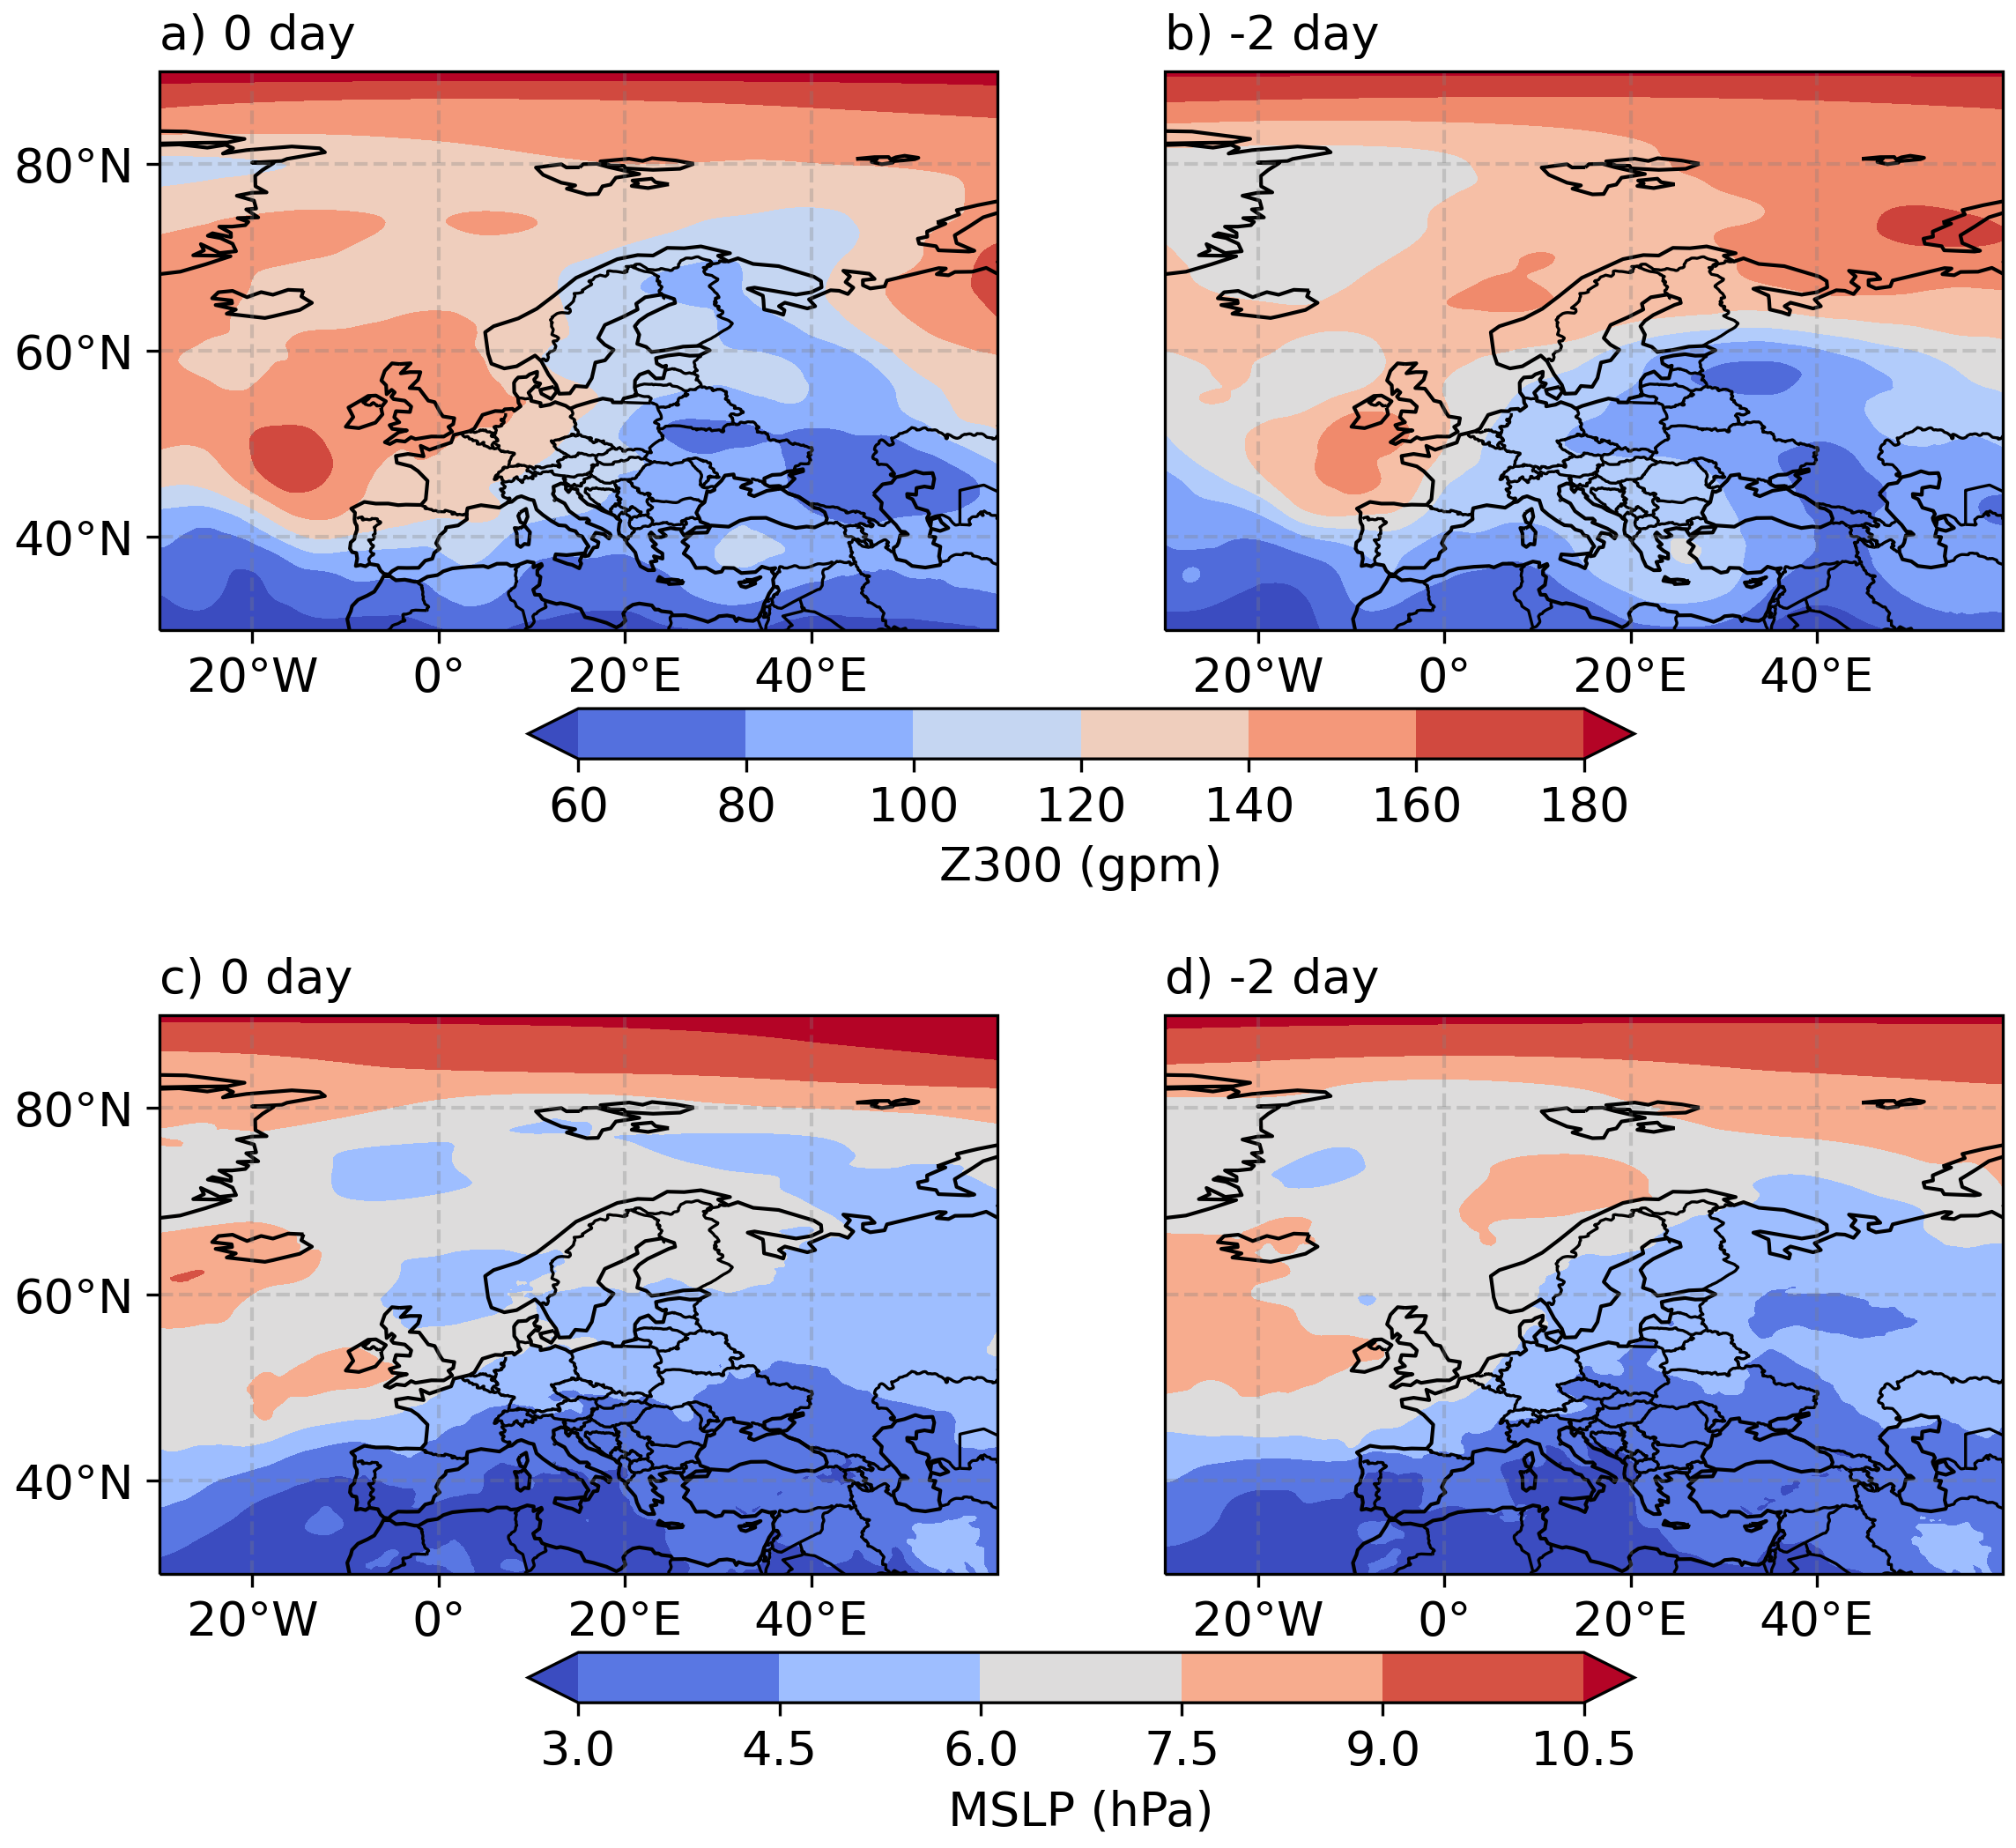
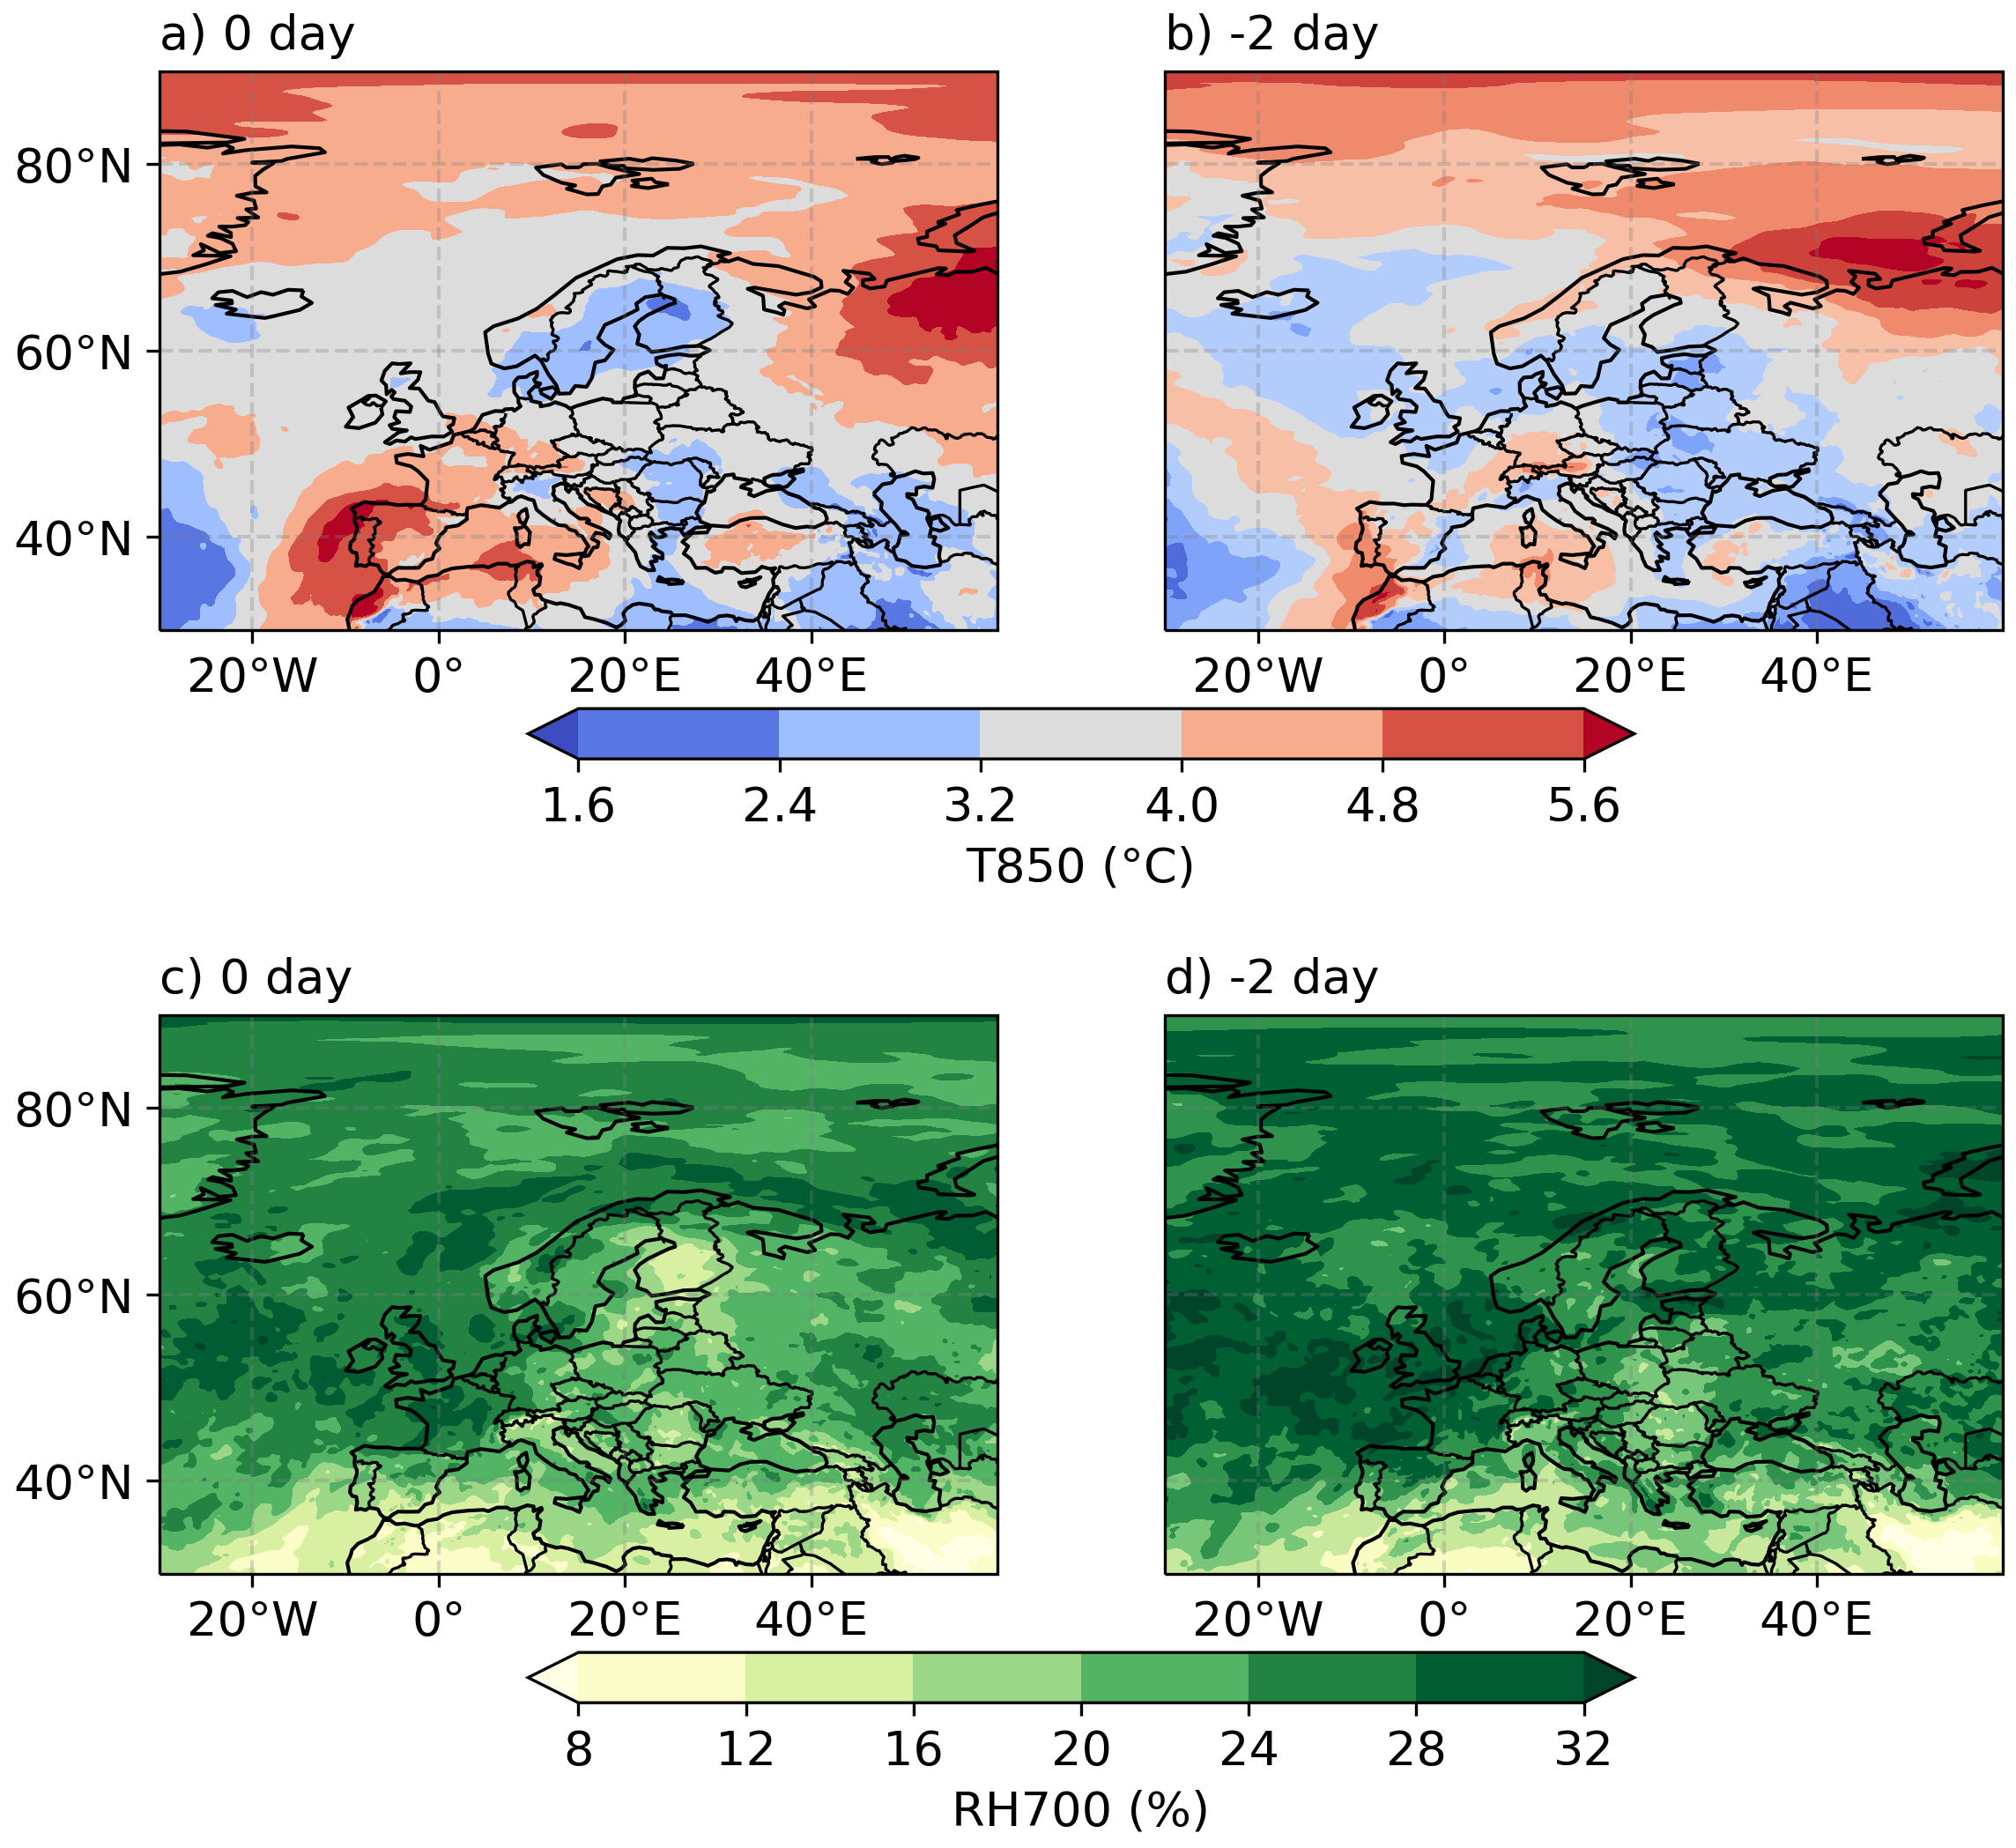
The composite mean large-scale weather patterns on day -1, -2 and -3 (shown only on day -2 in Fig. 1b, d and Fig. 2b, d) generally resemble those on day 0 (Fig. 1a, c and Fig. 2a, c). Over Finland, mean sea level pressure decreases, and the 300-hPa geopotential height, 850-hPa temperature and 700-hPa moisture increase from day -3 towards day 0. On day -1, standard deviations of 300-hPa geopotential, 850-hPa temperature and mean sea level pressure over Fennoscandia are generally small (not shown). On day -2, the standard deviations are slightly larger than on day 0 over most parts of Fennoscandia (Fig. 3b, d and Fig. 4b, d). However, on day -3, standard deviations of mean sea level pressure and 300-hPa geopotential height are, in general, larger than on day 0, -1 and -2 over most parts of Fennoscandia, western Russia and eastern North Atlantic (not shown).
To summarize, our results suggest that intense thunderstorm days in Finland are associated with an upper-level ridge over Fennoscandia, a surface high pressure over western Russia and the spread of warm and moist airmass from the south. The mean large-scale weather pattern is rather similar for at least the three preceding days. However, large case-to-case variability, especially in the northward extent of the upper-level ridge and the strength of the low-pressure areas over Fennoscandia and eastern North Atlantic, is seen on day -3. This suggests that the large-scale weather pattern is robust between day 0 and -2. However, it is possible that the large-scale weather evolution is different for thunderstorms in different regions in Finland, which could be a topic for a future study. This study could also be continued by assessing whether the most intense thunderstorm days have been associated with anomalous large-scale weather patterns and whether the environment differs from weaker events.
Acknowledgements. We thank CSC – IT Center for Science, Finland, for computational resources and ECMWF for providing the ERA5 reanalysis, which is available from the Copernicus Climate Change Service’s Climate Data Store. This work was supported by the MONITUHO project (grant no. 647/03.02.06.00/2018) and Academy of Finland Flagship funding (grant no. 337552).
References
Hersbach, H., and Coauthors, 2020: The ERA5 global reanalysis. Q J R Meteorol Soc., 146, 1999–2049, https://doi.org/10.1002/qj.3803
Laurila T. K., and A. Mäkelä, 2019: Thunderstorm observations in Finland – historical observations since 1887. FMI’s Climate Bulletin Research Letters, 1(2), 4, https://doi.org/10.35614/ISSN-2341-6408-IK-2019-13-RL
Priestley, and Coauthors, 2020: An overview of the extratropical storm tracks in CMIP6 historical simulations. Journal of Climate, 33(15), 6315–6343, https://doi.org/10.1175/JCLI-D-19-0928.1
Punkka, A., and M. Bister, 2015: Mesoscale Convective Systems and Their Synoptic-Scale Environment in Finland. Weather Forecast., 30, 1, 182–196, https://doi.org/10.1175/WAF-D-13-00146.1
HOW TO CITE THIS ARTICLE:
Virman M., T. K. Laurila, and H. Gregow, 2023: Large-scale weather patterns associated with intense thunderstorm days in Finland, FMI’s Clim. Bull. Res. Lett., 5(1), 12–14, https://doi.org/10.35614/ISSN-2341-6408-IK-2023-05-RL
CITATION INFORMATION:
Authors: Meri Virman, Terhi K. Laurila, Hilppa Gregow
Received: Jan 5, 2023
Accepted: Mar 15, 2023
First online: Apr 12, 2023
Published: May 15, 2023
Journal: FMI’s Climate Bulletin Research Letters
Volume: 5
Issue: 1
Pages: 12–14
DOI: https://doi.org/10.35614/ISSN-2341-6408-IK-2023-05-RL
This article is part of the ACCC Special Issue.
Header image: Adobe Stock