In this paper, we present daily gridded evapotranspiration dataset covering Finland over the 40-year period 1981–2020. The dataset representing evapotranspiration from a reference surface is freely available in a 1 km × 1 km grid.
PENTTI PIRINEN1, ILARI LEHTONEN1, RISTO K. HEIKKINEN2, KAISU AAPALA2, JUHA AALTO1
1Finnish Meteorological Institute
2Finnish Environment Institute
Introduction. Evapotranspiration is the combination of two separate processes, evaporation and plant transpiration. Evaporation accounts for the vaporisation of liquid water to the atmosphere from evaporative surfaces, such as the soil and water bodies, while transpiration accounts for the vaporisation of the liquid water from plant tissues to the atmosphere as part of life cycle of the plants. Both processes occur simultaneously and there is no simple way to distinguish between them.
Evapotranspiration is a central part of the hydrological cycle. Thus, it is one of the most important hydrometeorological variables in agrometeorology, and also plays a key role in assessing the susceptibility of natural ecosystems to climate change and land use driven phenomena, particularly droughts (Fisher et al., 2011; Yang et al., 2015). Evapotranspiration is affected by weather parameters, water availability and the evaporative surface. The most important weather parameters influencing evapotranspiration are air temperature, relative humidity, wind speed and solar radiation.
Materials and methods. Several methods have been developed to estimate evapotranspiration by using different climatic variables (McMahon et al., 2013; Guo et al., 2016). Here, we used the standard method recommended by the Food and Agricultural Organization of the United Nations (FAO) for calculating the reference crop evapotranspiration (ET0) from daily weather data. This so-called FAO Penman–Monteith equation can be written as follows (Allen et al., 1998, 2006):
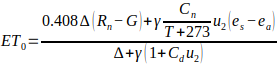
where Rn is the net radiation at the crop surface (MJ m-2 day-1), G the soil heat flux density (MJ m-2 day-1), T the air temperature at 2 m height (°C), u2 the wind speed at 2 m height (m s-1), es the vapour pressure of the air at saturation (kPa), ea the actual vapour pressure (kPa), Δ the slope of the vapour pressure curve (kPa °C-1), Cn and Cd are coefficients related to reference surface and calculation time step and ƴ is the psychrometric constant (kPa °C-1) as defined below. In daily time step computations, G may be ignored (Allen et al., 1998). Following the FAO recommendations for calculations with daily time step, we used values of Cn = 900 and Cd = 0.34 characterising a reference surface with a crop height of 0.12 m, a fixed surface resistance of 70 s m-1 and an albedo of 0.23. Surface resistance describes the restriction of vapour from land surface in the water exchange process, without using land surface temperature data, and albedo describes the proportion of solar radiation reflected from the surface. The psychometric constant ƴ is defined as follows:

where cp is specific heat of air at constant pressure (1.013×10³ MJ kg-1 °C-1), p is the atmospheric pressure (kPa), rMW is the ratio of molecular weight of water vapour to dry air (0.622) and λ is latent heat of water vaporisation (2.45 MJ kg-1).
In the constructed dataset, daily values of ET0 over the period 1981–2020 from April to September were incorporated in a 1 km × 1 km lattice system covering Finland. The weather data required for calculating ET0 were extracted from the Finnish daily gridded climatological dataset (Aalto et al., 2016), except the wind data, which were interpolated from the ERA5 reanalysis (Hersbach et al., 2020). Wind speed provided in the ERA5 at 10 m height was adjusted to 2 m height using a conversion factor of 0.748, as suggested by Allen et al. (1998) assuming a logarithmic wind speed profile. The wind data were originally presented in a 0.25° × 0.25° spatial resolution, while the other weather variables were interpolated into the 1 km × 1 km grid from station observations using kriging with external drift. Net radiation data were an exception, since Rn values used in the interpolation were mainly estimated based on cloudiness observations prior the mid-1990s as described by Venäläinen and Heikinheimo (1997). However, when measurements of Rn were available, we used the measured values and from 2008 onwards, only measured data for Rn was used. Saturation vapour pressure deficit () was calculated separately with daily maximum and minimum temperatures, assuming constant relative humidity throughout a day, and the daily average saturation vapour pressure deficit was then calculated as an average of the two daily values.
Discussion and evaluation of the results. Monthly ET0 values in the gridded dataset were compared with evaporation measurements conducted by the Finnish Environment Institute with standard Class-A evaporation pans (e.g., Jovanovic et al., 2008) from May to September over the period 1981–1995 on three locations: Jokioinen, Jyväskylä and Mikkeli. We also calculated ET0 values from station observations on these locations by using an R package developed by Guo et al. (2016). Fig. 1 shows that ET0 values in the created gridded dataset were close to those calculated from station data, though ET0 tended to be slightly higher in the gridded data, particularly in late season. The comparison to pan measurements shows that from May to July, calculated ET0 values were consistently somewhat lower than those measured with evaporation pans, the difference being approximately 20% in Jokioinen and Jyväskylä and 5–10% in Mikkeli. In August and September, calculated ET0 values were closer to measured pan evaporation, except in Mikkeli where calculated ET0 was clearly higher in September. This was because in September measured pan evaporation was approximately one third lower in Mikkeli compared to the two other locations. In contrast, calculated ET0 values were close to each other at all locations (not shown), even though in Jokioinen and Jyväskylä Rn was measured, while in Mikkeli it was estimated from cloudiness observations. It is also noteworthy that from May to August measured pan evaporation was lower in Mikkeli than in the two other locations although there is no climatological reason for this difference suggesting that there would be a high uncertainty related to the pan evaporation measurements.
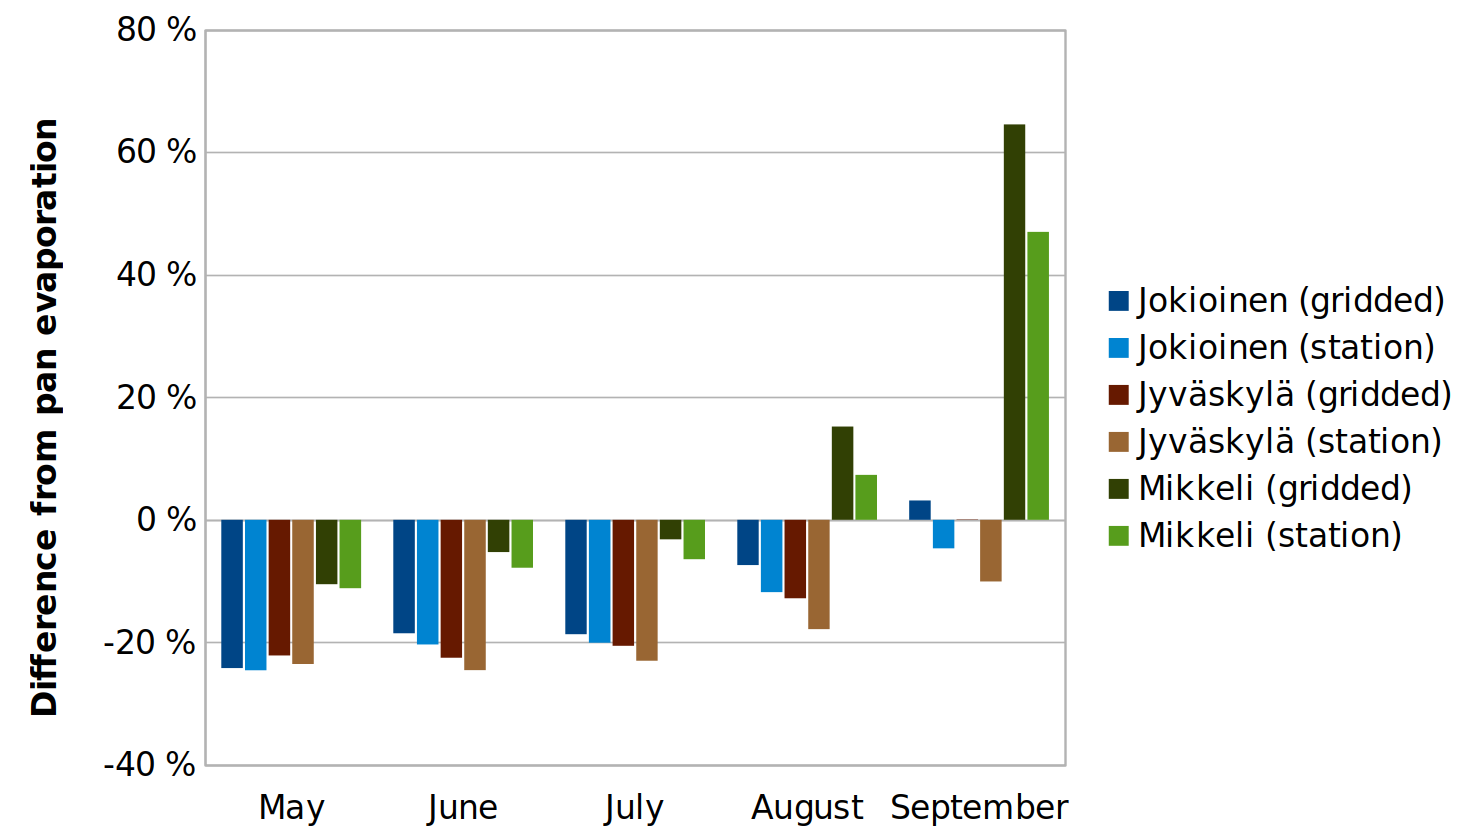
It has been previously recognized that pan data should be treated with caution if used to approximate daily potential evapotranspiration. This is because correlations between daily estimates of ET0 with Eq. (1) and pan data can be poor, though they improve over longer timer periods (Chiew and McMahon, 1992). Moreover, studies conducted in Florida and Canada have indicated that when daily weather data is used with Eq. (1), the equation overestimates ET0 on annual scale by about 10% compared to pan measurements (Irmak and Haman, 2003; Xing et al., 2008). However, the results of Irmak and Haman (2003) from Florida showed that this overestimation increases with decreasing daylight time. According to their results, from May to July calculated ET0 was even underestimated by 3%, while the largest overestimation of 52% took place in December. This agrees with our findings, showing the largest underestimation of calculated ET0 from May to July when daylight time is the longest, actually much longer in Finland than in Florida, which is in accordance with larger underestimation of calculated ET0. However, in using the constructed evapotranspiration data, it should be kept in mind that calculated ET0 represents evapotranspiration from a reference surface which may differ to various degree from real environment in Finland.
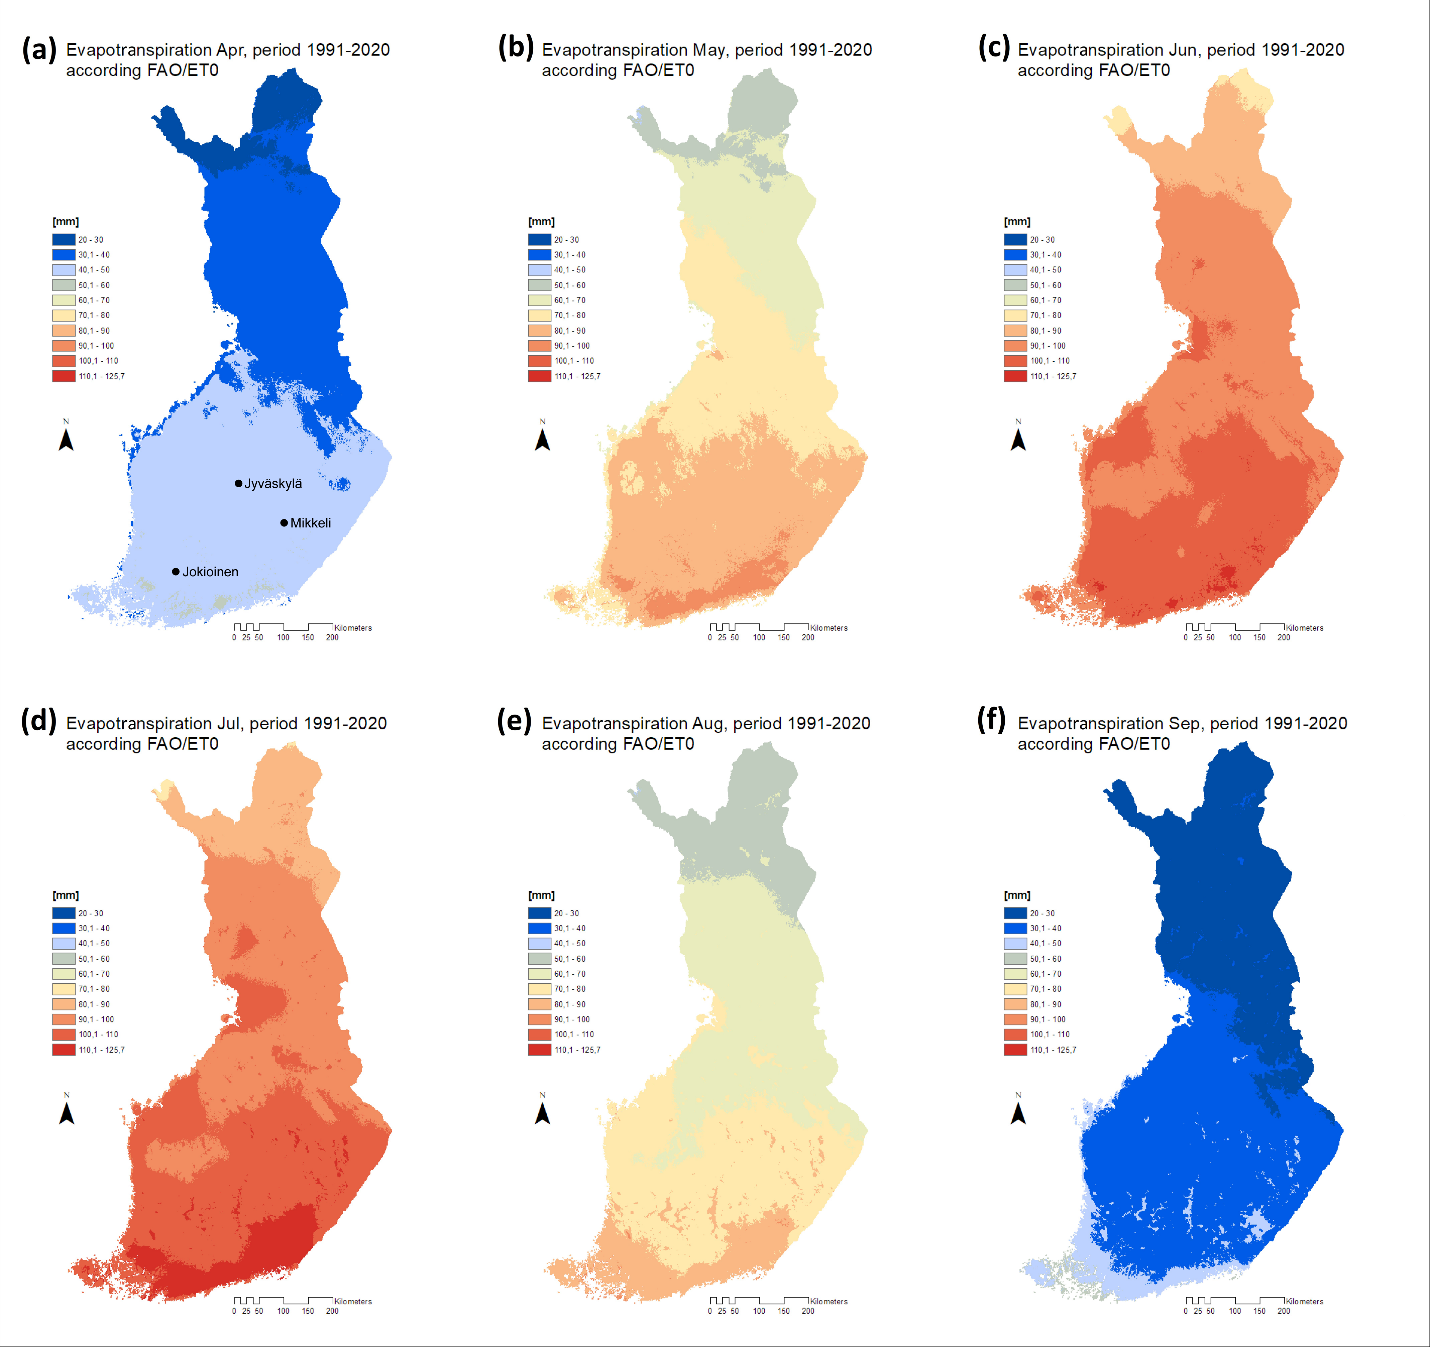
Monthly maps of average evapotranspiration in Finland. Monthly maps of average ET0 over the World Meteorological Organization (WMO) normal period 1991–2020 are presented in Fig. 2. In Finland, evapotranspiration is highest in July and June. Moreover, evapotranspiration decreases towards the north in accordance with decreasing temperature and global radiation (Venäläinen and Heikinheimo, 1997; Jokinen et al., 2021).
Data availability. The created gridded dataset will be made freely available for download at https://en.ilmatieteenlaitos.fi/gridded-observations-on-aws-s3. We will moreover update the dataset to cover also the period 1961–1980.
Acknowledgements: This work was supported by funding provided by the Finnish Ministry of the Environment (SUMI project; decision VN/33334/2021).
References
Aalto, J., P. Pirinen, and K. Jylhä, 2016: New gridded daily climatology of Finland: Permutation-based uncertainty estimates and temporal trends in climate. J. Geophys. Res. Atmos., 121, 3807–3823, https://doi.org/10.1002/2015JD024651.
Allen, R. G., L. S. Pereira, D. Raes, and M. Smith, 1998: Crop evapotranspiration: guidelines for computing crop requirements. FAO Irrigation and Drainage Paper No. 56., https://www.fao.org/3/X0490E/X0490E00.htm.
Allen, R. G., and Coauthors, 2006: A recommendation on standardized surface resistance for hourly calculation of reference ET0 by the FAO56 Penman-Monteith method. Agr. Water Manage., 81, 1–22, https://doi.org/10.1016/j.agwat.2005.03.007.
Chiew, F. H. S. and T. A. McMahon, 1992: An Australian comparison of Penman’s potential evapotranspiration estimates and class A evaporation pan data. Aust. J. Soil. Res., 30, 101–112, https://doi.org/10.1071/SR9920101.
Fisher, J. B., R. J. Whittaker, and Y. Malhi, 2011: ET come home: potential evapotranspiration in geographical ecology. Global Ecol. Biogeogr., 20, 1–18, https://doi.org/10.1111/j.1466-8238.2010.00578.x.
Guo, D., S. Westra, and H. R. Maier, 2016: An R package for modelling actual, potential and reference evapotranspiration. Environ. Modell. Softw., 78, 216–224, https://doi.org/10.1016/j.envsoft.2015.12.019.
Hersbach, H., and Coauthors, 2020: The ERA5 global reanalysis. Quart. J. Roy. Meteorol. Soc., 146, 1999–2049, https://doi.org/10.1002/qj.3803.
Irmak, S. and D. Z. Haman, 2003: Evaluation of five methods for estimating Class A pan evaporation in a humid climate. HortTechnology, 13, 500–508, https://doi.org/10.21273/HORTTECH.13.3.0500.
Jokinen, P., P. Pirinen, J. Kaukoranta, A. kangas, P. Alenius, P. Eriksson, M. Johansson, and S. Wilkman, 2021: Climatological and oceanographic statistics of Finland 1991–2020. Finnish Meteorological Institute Reports 2021:8, 170 pp, https://doi.org/10.35614/isbn.9789523361485.
Jovanovic, B., D. A. Jones, and D. Collins, 2008: A high-quality monthly pan evaporation dataset for Australia. Clim. Change, 87, 517–535, http://dx.doi.org/10.1007/s10584-007-9324-6.
McMahon, T. A., M. C. Peel, L. Lowe, R. Srikanthan, and T. R. McVicar, 2013: Estimating actual, potential, reference crop and pan evaporation using standard meteorological data: a pragmatic synthesis. Hydrol. Earth Syst. Sci., 17, 1331–1363, https://doi.org/10.5194/hess-17-1331-2013.
Venäläinen, A. and M. Heikinheimo, 1997: The spatial variation of long-term mean global radiation in Finland. Int. J. Climatol., 17, 415–426, https://doi.org/10.1002/(SICI)1097-0088(19970330)17:4%3C415::AID-JOC138%3E3.0.CO;2-%23.
Xing, Z., L. Chow, F. Meng, H. W. Rees, J. Monteith, and S. Lionel, 2008: Testing reference evaporation estimation methods using evaporation pan and modeling in maritime region of Canada. J. Irrig. Drain. Eng., 134, 417–424, http://doi.org/10.1061/(ASCE)0733-9437(2008)134:4(417).
Yang, H., and Coauthors, 2015: Ecosystem evapotranspiration as a response to climate and vegetation coverage changes in Northwest Yunnan, China. Plos One, 10, e0134795, https://doi.org/10.1371/journal.pone.0134795.
HOW TO CITE THIS ARTICLE:
Pirinen P., I. Lehtonen, R. K. Heikkinen, K. Aapala, and J. Aalto, 2022: Daily gridded evapotranspiration data for Finland for 1981–2020, FMI’s Clim. Bull. Res. Lett., 4(2), 35–37, https://doi.org/10.35614/ISSN-2341-6408-IK-2022-11-RL
CITATION INFORMATION:
Authors: Pentti Pirinen, Ilari Lehtonen, Risto K. Heikkinen, Kaisu Aapala, Juha Aalto
Received: March 3, 2022
Accepted: June 3, 2022
First online: July 6, 2022
Published: December 20, 2022
Journal: FMI’s Climate Bulletin Research Letters
Volume: 4
Issue: 2
Pages: 35–37
DOI: https://doi.org/10.35614/ISSN-2341-6408-IK-2022-11-RL
Header image: Adobe Stock