Continuous measurements of air quality are needed in outdoor and indoor sports and recreation areas to raise awareness of the breathable air conditions and to help mitigate the accumulating health risks.
HILPPA GREGOW, ANTTI MÄKELÄ, PENTTI PIRINEN, ACHIM DREBS, JUUSO RAINNE, ANNALEA LOHILA, HILKKA TIMONEN
Finnish Meteorological Institute
Introduction. Climate change is expected to increasingly impact the indoor and outdoor conditions in the future (IPCC 2021). In regard to football, it is urgent to promote climate neutrality and meet e.g., the UEFA2030 climate targets in mitigation and adaptation (UEFA 2022). In addition, it is evident that health risks in the breathable air, including risks both related to poor air quality and spreading of diseases such as COVID-19 should be mitigated proactively as well as possible.
Due to COVID-19 there was a fully unexpected lockdown of societies in 2020–2021 (Torkmahalleh et al. 2021). The Finnish Meteorological Institute (FMI) was asked by the football clubs to help investigate how COVID-19 is spreading in the air and what restrictions are essential in outdoor conditions as well as indoor inflatable arenas.
The air quality in football arenas has been a concern, e.g., due to volatile compounds emitted by the artificial turf fields (Salonen et al. 2015) and more lately due to COVID-19 superspreading events. During COVID-19 pandemic it was noticed that aerosols containing SARS-CoV-2 are co-exhaled with CO2 by people with COVID-19 infection. It was then found that CO2 can also be used as a proxy of SARS-CoV-2 concentrations indoors (Peng and Jimenez 2021).
Very limited amount of information exists about the air quality in the modern inflatable football arenas. In the study by Salonen et al. (2015), health impacts related to compounds emitted by the artificial turf, particulate matter (PM) and microbial emissions have been concerns related to older indoor arenas and more than half of adolescent football players using the studied arenas reported at least one symptom or nuisance (e.g., sore throat, running nose). Most studies indicate PM2.5 at or below 12 μg/m3 is considered to carry little to no risk from exposure (IAHI 2022). According to IAHI (2022), peaks above 35 μg/m3/24 hours can cause issues for people with existing breathing issues, such as asthma. Long-range transports (LRT) are an important source of pollution in ambient air, but their impact has not been studied in regard to football arenas.
In this article we describe, what efforts we have made in 2021–2022, and what we have learned about air quality outside and inside an inflatable football arena located in Järvenpää, southern Finland.
Experimental setup. In many ways the large inflatable arenas that are commonly used in the football are more resembling outdoor conditions than indoor due to their size, volume and effective ventilation. Our measurements were conducted in a modern inflatable football arena (volume of 144 000 m3) located in Järvenpää (Fig. 1).
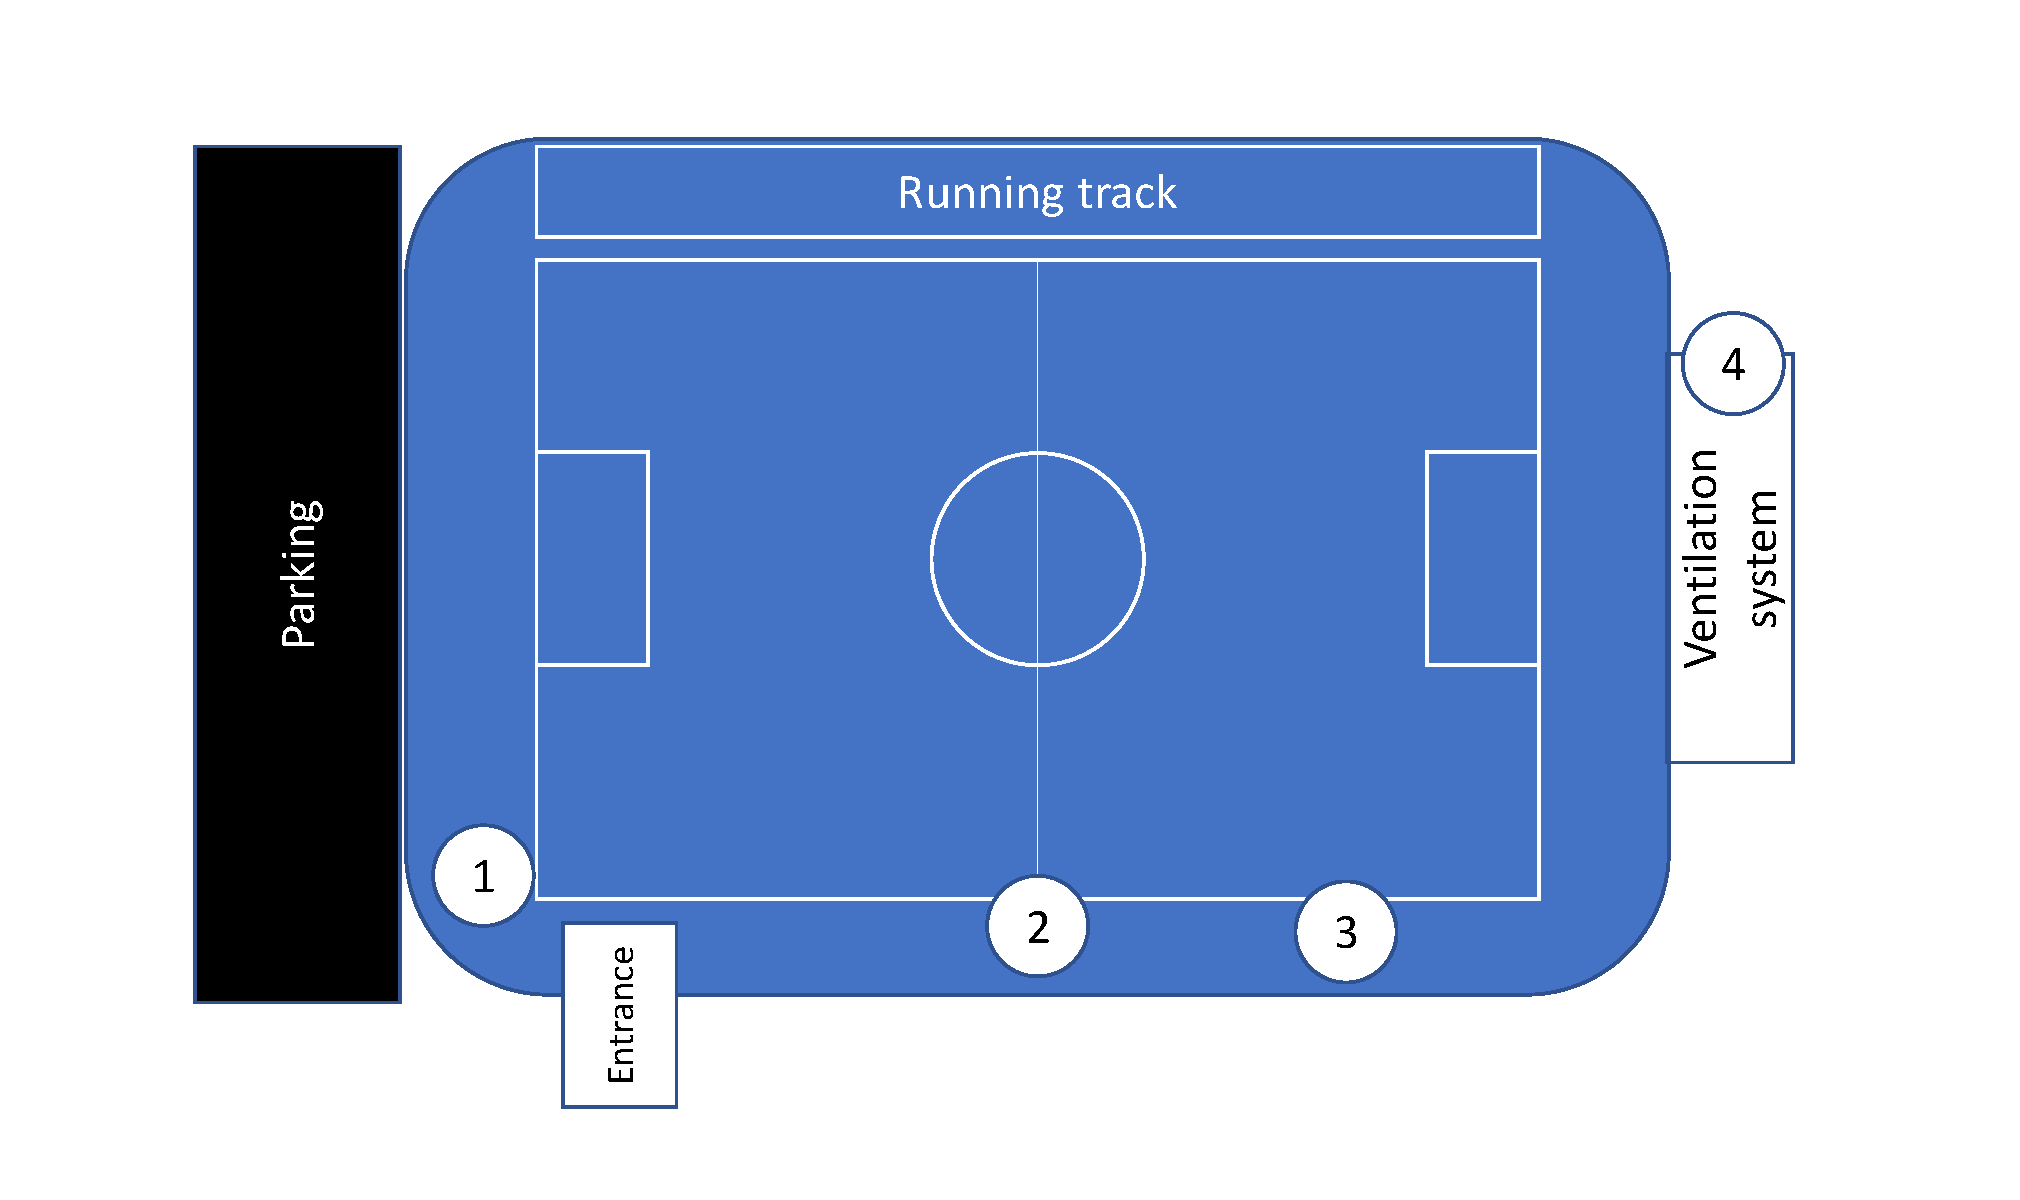
To study the air transmission and conditions in the football arena, we made preliminary air flow, temperature and relative humidity measurements using a hot-wire anemometer (VelociCalc 8347) in the football arena on April 16th 2021. We reveived the number of participants in trainings and games from JäPs (1.11.–27.11.2021). Furthermore, between June 2021 and February 2022, three SmartCitizen low-cost sensors, developed in H2020 iScape-project (see https://smartcitizen.me/ and http://www.iscapeproject.eu) were used to monitor PM1, PM2.5, PM10, (refers to particles with diameter smaller than 1, 2.5 and 10 µm), eCO2 (i.e., a metric measure used to compare the emissions from various greenhouse gases on the basis of their global-warming potential), TVOC (total VOC) concentrations, as well as light, noise and meteorological parameters (Temperature (T), relative humidity (RH), pressure (P)) with time resolution of 1 min. The sensors were installed to western side of the arena, in the middle and to both ends of the arena (Fig. 1) at approximately 1.5–3 m height, depending on where it was safe and where electricity to install the sensor was available. Prior to measurements, a co-location study was carried out to ensure the results of sensors are comparable (results not shown). One CO2/H20 analyzer (Licor LI-840A) was installed in the arena for two weeks in spring 2022 to compare the results of the low-cost sensors. Luukki (Northern Espoo, 45 km from the Järvenpää) clean background air quality station was used in the LRT investigations.
Results. In April 2021, the hot-wire anemometer measurements indicated that the largest air flows (> 7–10 m/s) were observed in the proximity of air vents and lowest (< 0.1 m/s) in the middle and in the corners on the side of the running track. During the training hours (12:00–22:00) in November–March the mean temperature varied between -0.6 ℃ and 4.1 ℃ and the mean humidity between 63.6 % and 77.4 %, with maximum and minimum that were much larger and smaller. In summertime, a clear diurnal cycle was observed, with minimum in the night time and maximum in the afternoons, similarly as in the ambient air. This was expected, as the air flow from outdoor to indoor is 70000 m3/h to inflate the arena.
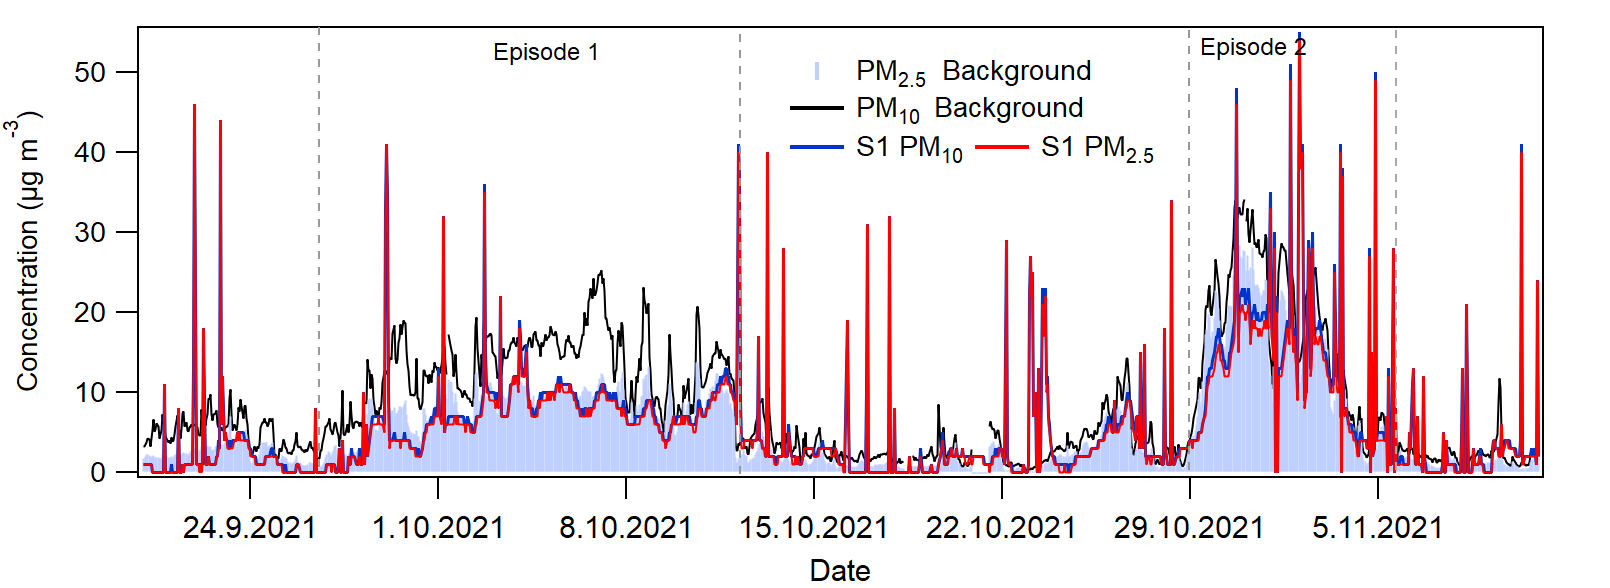
Indoor, the measured PM2.5 and PM10 concentrations were mostly low. However, random peaks of PM2.5 above 12 µg/m3 and for PM10 of 50 µg/m3 (daily average safety limit) did occur (Fig. 2). To study the influence of outdoor air to the air quality in the football arena, we studied how the two long-range transport (LRT) episodes (marked with Episode 1 and Episode 2), visible in the HSY Luukki Air quality station as an increase in particulate matter concentrations, are seen in the football arena (Fig. 2). During both LRT episodes a clear increase was seen, with nearly as large PM2.5 and PM10 concentrations indoors as outdoors. During Episode 2 trainings took place (Fig. 3).
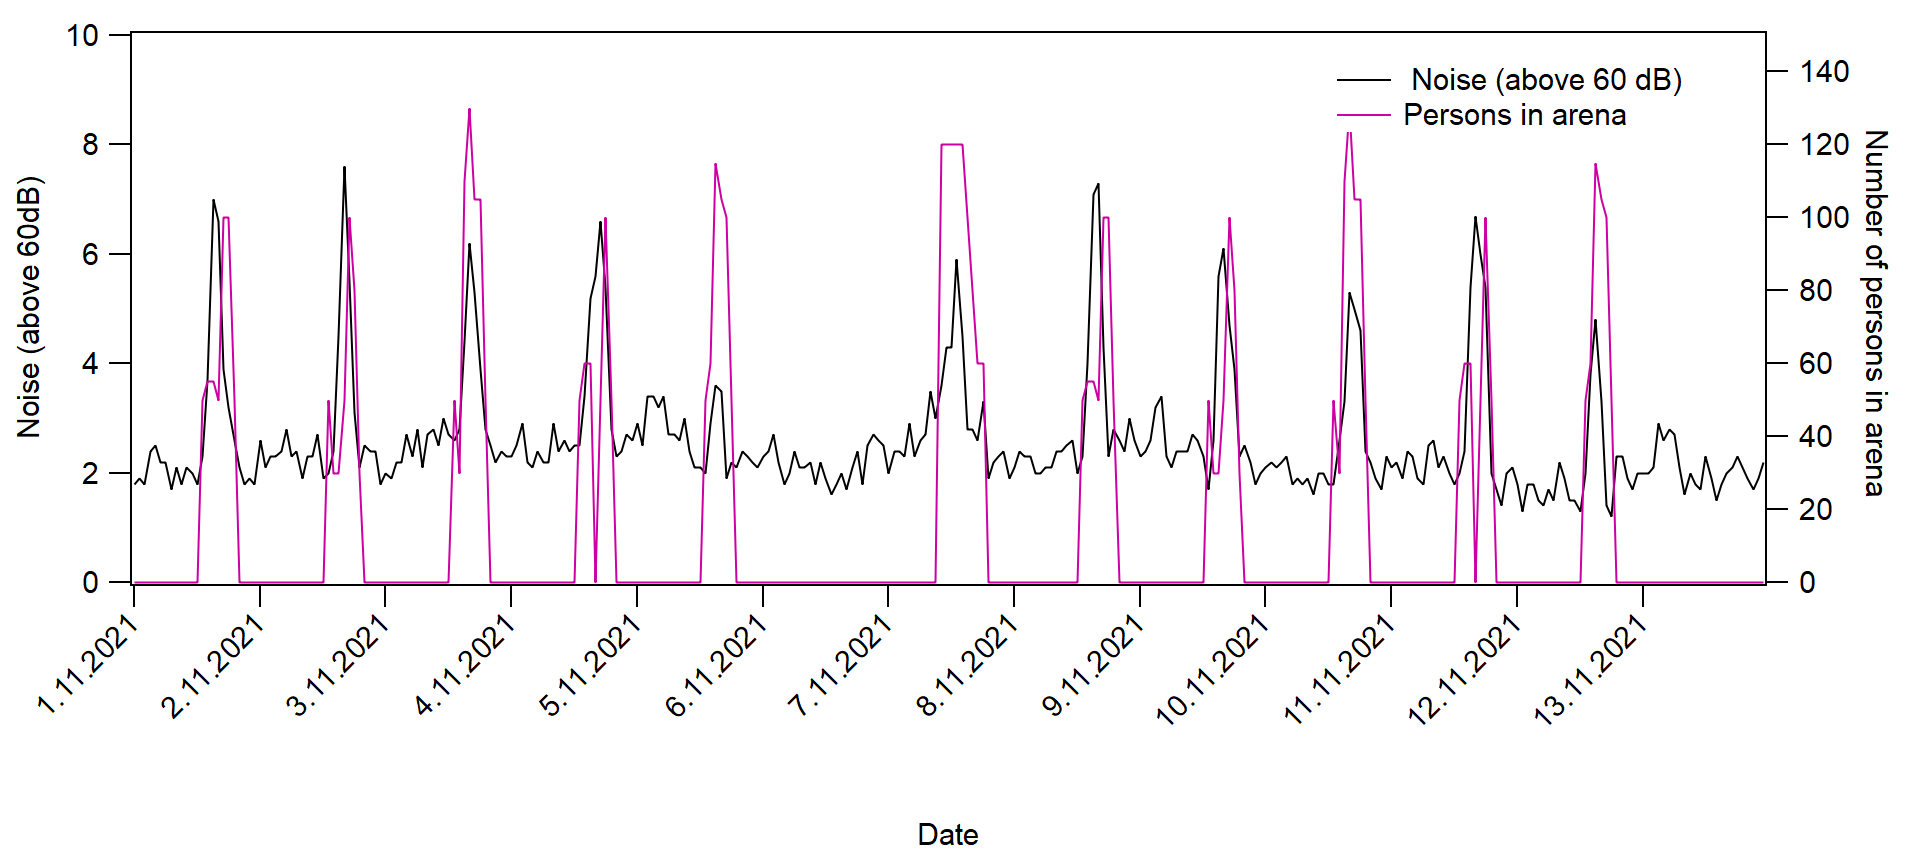
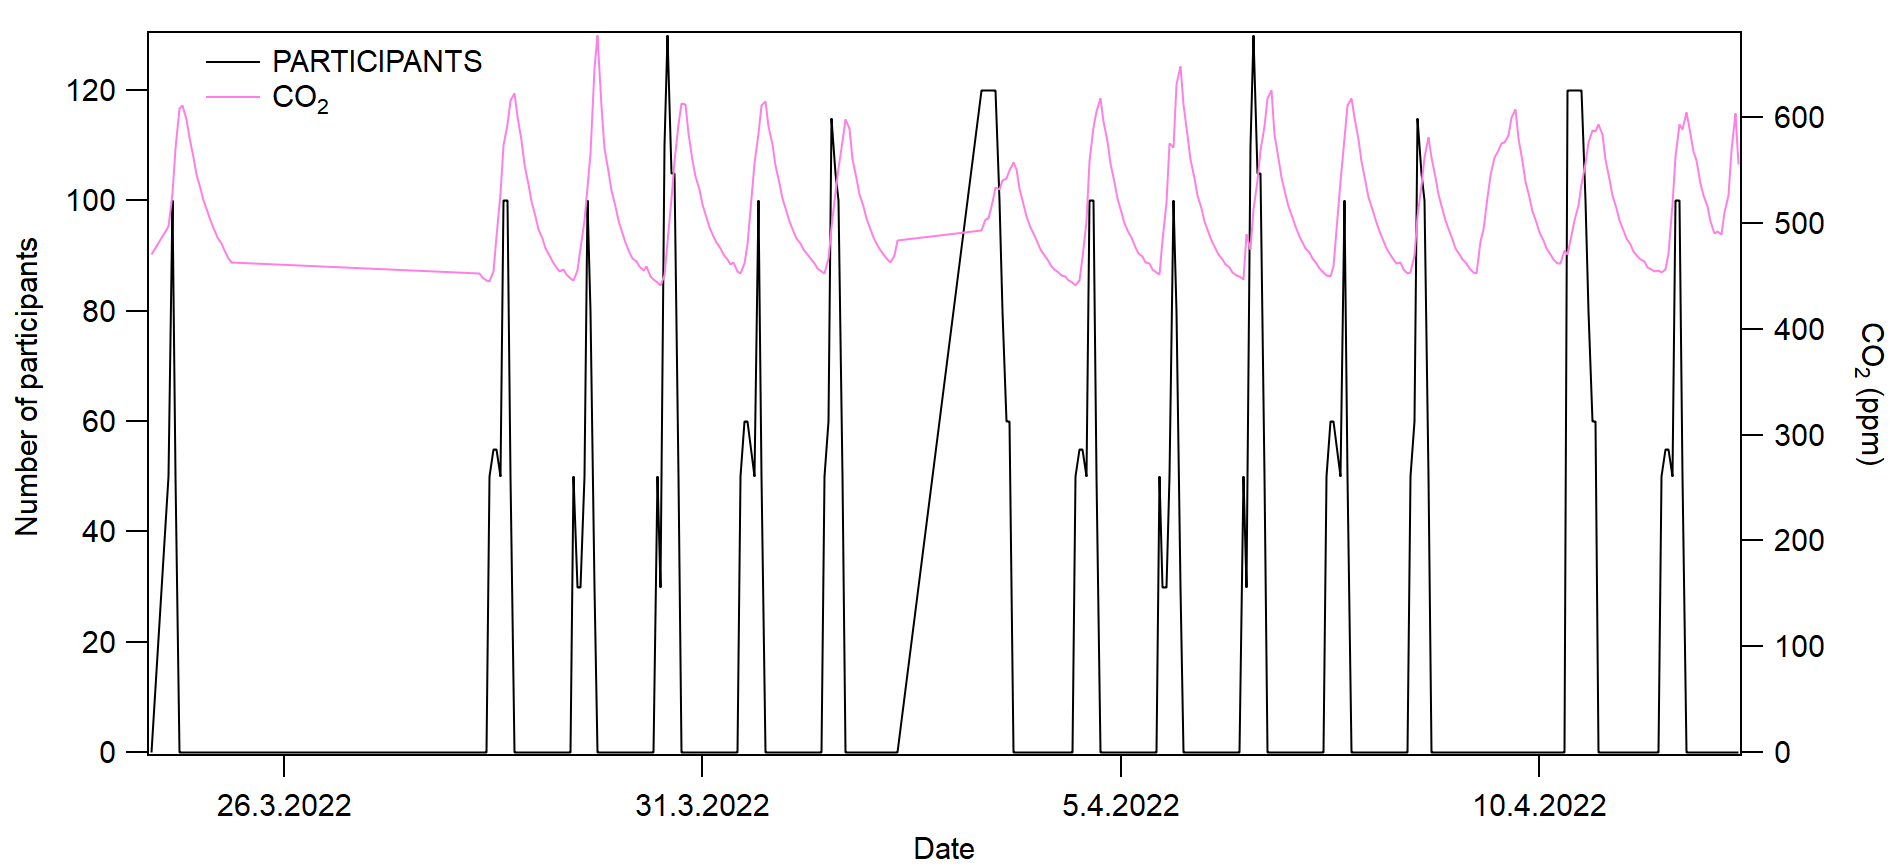
In the inflatable football arena in Järvenpää, the incoming air flow is 70000 m3/h. When the incoming air flow is compared to human breathing (rough estimate: 90 l/min in exercise, for 100 persons the breathing volume is 540000 l/h, i.e., 540 m3/h), the breathing volume is negligible (< 1 %). We found that eCO2 has some correlation with the number of participants and noise. However, the eCO2 was found to be influenced by other greenhouse gases such as water vapour. On the other hand, the number of participants and noise with values exceeding 60 dB had clear correlation (r = 0.66) in the arena. Thus, noise was considered to serve as a new indicator for assessing the number of people present in the football activities (Fig. 3). We note that the variation in CO2 concentration was modest (between 420–650 ppm), likely due to strong ventilation.
Discussion and conclusions. Meteorological measurements conducted by the low-cost sensors show that the conditions in the arena vary a lot during the year, likely affecting the training conditions as well. Although the PM sensors are not the most reliable ones, they demonstrated that the PM concentrations were mainly low. However, random PM2.5 peaks above recommended safe 24-hourly levels (12 µg/m3) did occur during the long-range transport episode and a local fire.
As regards the COVID-19 infection risk monitoring, we learned that the measured noise correlated with the number of participants in the arena. The number of participants also correlated with CO2, which we measured with Licor during two weeks in Spring 2022. Based on Peng and Jimenez (2021), we assume that our future research should focus on proving if noise can also be used as a proxy of SARS-CoV-2 concentrations indoors. We should also do simulations, as based on the preliminary assessment, we found spots where the air was not moving. In addition, we should focus on temperature and humidity conditions, since based on Ai et al. (2022) the risk of COVID-19 infection was found to be the highest at temperature below 5 ℃ and with low relative humidity. In Järvenpää, the mean training temperature was below 5 ℃ in November–March, thus increasing risk, whereas the relative humidity was mostly above 60 %, thus decreasing risk. All in all, to better know how to improve the level of safety in the inflatable football arenas in regard to COVID-19 infection as well as the overall breathable air risks, we conclude that there is an urgent need for more measurements and research.
Acknowledgements: Funding from the Academy of Finland, Flagship (grant no. 337552) is gratefully acknowledged. Collaboration with the football clubs and their representatives, MPS (Malmin Palloseura) Jukka Airaksinen and JäPS (Järvenpään Palloseura) Jari Kurittu and Marika Hagelin, are acknowledged for inviting science to meet practice. Tero Auvinen from Finnish Football Association and Mihaly Szerovay (University of Jyväskylä) are acknowledged for boosting collaboration.
References
Ai, H., R. Nie, and X. Wang, 2022: Evaluation of the effects of meteorological factors on COVID-19 prevalence by the distributed lag nonlinear model. J. Transl. Med., 20, 170, https://doi.org/10.1186/s12967-022-03371-1.
IAHI, 2022: PM2.5 Explained. Accessed 12 July 2022, https://www.indoorairhygiene.org/pm2-5-explained/.
IPCC, 2021: Climate Change 2021: The Physical Science Basis. V. Masson-Delmotte et al., Eds., Cambridge University Press, Cambridge, United Kingdom and New York, NY, USA, 2391 pp. doi:10.1017/9781009157896.
Peng, Z. and J. L. Jimenez, 2021: Exhaled CO2 as a COVID-19 Infection Risk Proxy for Different Indoor Environments and Activities. Environ. Sci. Technol. Lett., 8, 392–397, https://doi.org/10.1021/acs.estlett.1c00183.
Salonen R. O., and Coauthors, 2015: Air quality problems related to artificial turf fields in indoor football arenas. National Institute for Health and Welfare Report 10/2015 (in Finnish, abstract in English), 45 pp, https://urn.fi/URN:ISBN:978-952-302-425-0.
Torkmahalleh, M. A., and Coauthors, 2021: Global Air Quality and COVID-19 Pandemic: Do We Breathe Cleaner Air?, Aerosol Air Qual. Res., 21, https://doi.org/10.4209/aaqr.200567.
UEFA, 2022: Our strategy, policies & targets. Accessed 1 May 2022, https://www.uefa.com/insideuefa/sustainability/strategy/.
HOW TO CITE THIS ARTICLE:
Gregow H., A. Mäkelä, P. Pirinen, A. Drebs, J. Rainne, A. Lohila, and H. Timonen, 2022: Preliminary results of outdoor and indoor air quality and micrometeorological measurements in an inflatable football arena, FMI’s Clim. Bull. Res. Lett., 5(1), 15–17, https://doi.org/10.35614/ISSN-2341-6408-IK-2022-13-RL
CITATION INFORMATION:
Authors: Hilppa Gregow, Antti Mäkelä, Pentti Pirinen, Achim Drebs, Juuso Rainne, Annalea Lohila, Hilkka Timonen
Received: May 2, 2022
Accepted: July 11, 2022
First online: July 12, 2022
Published: May 15, 2023
Journal: FMI’s Climate Bulletin Research Letters
Volume: 5
Issue: 1
Pages: 15–17
DOI: https://doi.org/10.35614/ISSN-2341-6408-IK-2022-13-RL
This article is part of the ACCC Special Issue.
Header image: Adobe Stock