The Finnish Meteorological Institute has recently developed a web-service that provides detailed hydrometeorological information to support more efficient hydropower production operations in Northern Finland. This service aims to reduce uncertainties in freshet forecasts through assimilation of satellite data-based cryosphere products to an in-house developed hydrological modelling system (HOPS) and an in-house developed machine learning streamflow forecasting algorithm. The service leverages common European efforts in climate monitoring by linking data from the Copernicus Climate Data Store with Copernicus seasonal forecasts data records as well as Copernicus Earth Observations.
JAAKKO IKONEN1, CEMAL TANIS1, MATTI KÄMÄRÄINEN1, MIRIAM KOSMALE1, HEIKKI POIKELA2, MIKKO STRAHLENDORFF1
1Finnish Meteorological Institute
2Kemijoki Oy
Background. Kemijoki Oy is the most important hydropower and adjustable power producer in Finland. Kemijoki Oy operates 16 hydropower plants and 4 regulated reservoirs in the Kemijoki watercourse area. These simultaneously act as the most important flood regulation structures in Northern Finland. Currently, hydropower production accounts for approximately 19% of total energy production in Finland. Freshet inflows to hydropower reservoirs, typically from mid-April/early-May to the end of June, accounts for 55 to 70% of the total annual inflows to reservoirs in the Kemijoki watershed. It is therefore essential to have careful planning and reservoir management schemes in place well before the onset of the peak inflow volumes. Reservoir management is important as the energy demand is out of phase with the natural availability of the water resources; typically, demand is higher during the colder months when the inflows are lower and vice versa. Hydropower producers need to redistribute the availability of these resources from the spring inflow periods to other times of the year when electricity demand is higher, i.e., during the six months of colder weather while maintaining the balance between a sufficiently large volume of water for optimal production and enough remaining capacity for safe flood risk management.
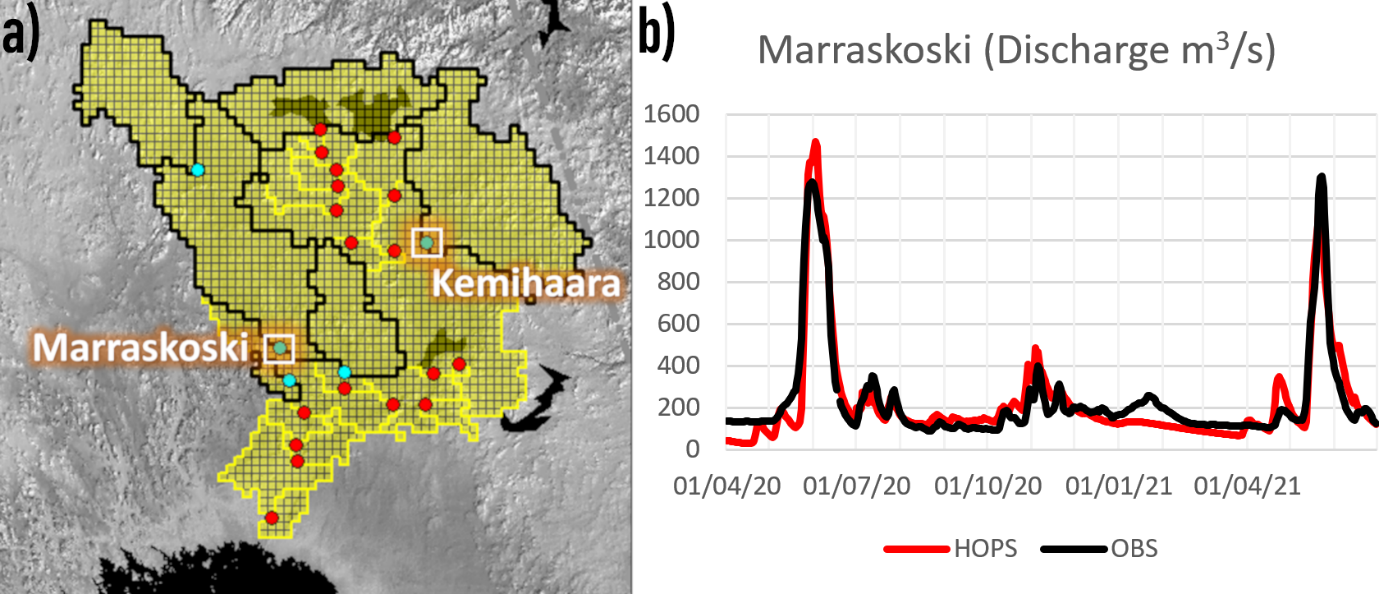
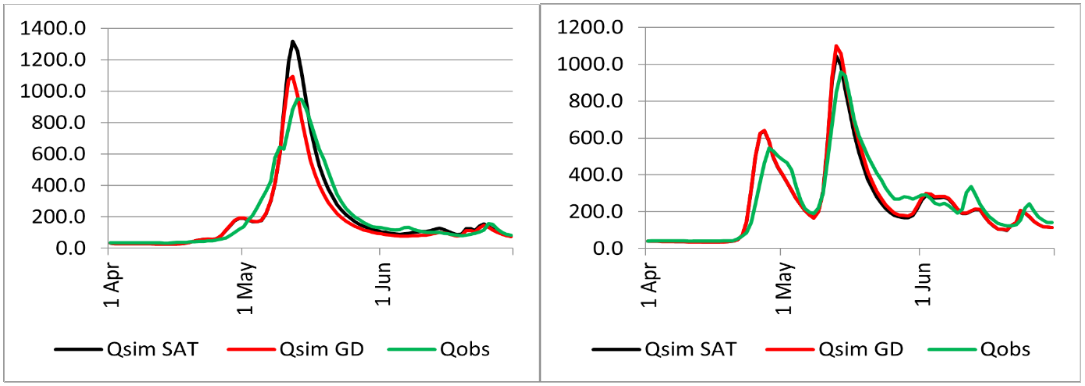
Traditional hydrological forecasting in the Kemijoki watershed. FMI’s Hydrological Operations and Predictions System (HOPS) model is used operationally by FMI to provide daily hydrological nowcasts, 10-day deterministic forecasts and 90-day ensemble forecasts for Kemijoki Oy over the entire Kemijoki watershed (FMI 2021). The HOPS modelling system consists of a distributed and modified version of the Sacramento Soil Moisture Accounting Model (SAC-SMA) (Burnash 1995) coupled with a modified version of the SNOW-17 temperature index snow accumulation and ablation model, a soil temperature model based on Rankinen et al. (2004) and an in-house developed distributed routing model accounting for overland, and channel flow retention and attenuation, based on hydrographic properties. The parameters for the SAC-SMA model are derived from a semi-physical a-priori parametrization scheme introduced by Koren et al. (2000). Satisfactory simulation results have been achieved (with an average Nash-Sutcliffe coefficient (NS) of efficiency of 0.79 and an average Pearson correlation of 0.94 between observations and hindcast simulations across selected validation points, see e.g., Fig. 1.) by running the modelling system without any calibration apart from manually adjusting parameters governing snowmelt rates.
Machine learning for a novel approach for hydrological forecasts. Machine learning algorithms have also been tested and implemented in the Kemijoki watershed with very promising results. The machine learning model used is based on gradient boosting. The machine learning process consists of constructing a carefully designed predictor set to which an optimized gradient boosting regression model between the predictor data and the streamflow observations in each measurement station using historical data between 2007–2020 is fitted. As predictors, the model uses the ECMWF HRES deterministic temperature and precipitation forecasts over the watersheds of measurement stations, the analytical representations of annual and daily cycles, and the observed streamflow of each station in an autoregressive manner. To be able to simulate the cumulative effect of, e.g., precipitation and melting processes, the weather model output is lagged in time multiple times; for example, when predicting the streamflow at t=0, precipitation values of the catchment grid cells from t=0, t=-1, t=-2, … t=-10 time steps are considered. The model was proven to be able to produce good forecasts despite a relatively small and restricted set of predictors, and with a more complete predictor data set, including, e.g., satellite observations and predicted snow depths, even better performance is expected.
Assimilation of satellite-based cryosphere products. Assimilation of Earth Observation (EO) based snow observations can significantly reduce uncertainties in hydrological model snowpack simulation. Currently Copernicus EO-based Snow Water Equivalent GlobLand SWE (Copernicus 2021) data is operationally assimilated into the HOPS modelling procedure. The use of EO-based snow observations offer two main types of advantages: 1) EO-based snow observations are independent from point scale observations (usually used to drive hydrological models), and 2) they provide basin-wide information and data on the state of the snowpack as opposed to point scale observations.
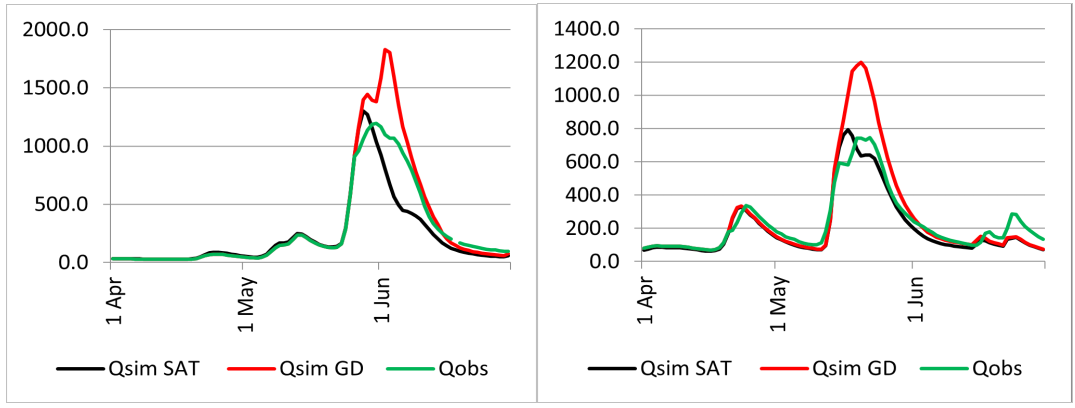
Snowfall is a dominant control variable in SWE accumulation. We modify snowfall forcing according to EO-based SWE observations to obtain the required model SWE accumulation constraint. In our application, the corrections are determined by comparing EO-based SWE observations with an initial model simulation and then applying the corrections retrospectively as part of a second model simulation. Example results of SWE assimilation can be seen in Fig 2. and Fig. 3. Assimilation of EO-based SWE data to HOPS model simulation runs in, for example the Kemihaara sub-basin, generally improves overall peak streamflow forecasting results. However, this is not always the case. In 2018, for example, the peak streamflow error to observed streamflow peak is increased from 141 m3/s to 365 m3/s. The NS coefficient and Pearson correlation between observed and simulated streamflow for the spring peak runoff period (April 1st to June 30th) is however not significantly affected. From 2019 onwards, assimilation of EO-based SWE observations improves spring streamflow forecast results with varying success. However, in general, improvements of both Pearson correlation and NS are minimal apart from the spring of 2021, where NS is increased from 0.49 to 0.89. The more significant improvements in simulation accuracies manifest improvements in peak streamflow error while peak flow timing errors remain largely unchanged. In spring 2019, the peak streamflow error is reduced from 141 m3/s to 86 m3/s and in 2020 from 247 m3/s to 105 m3/s as well as in 2021 from 451 m3/s to only 46 m3/s. In the spring of 2021, however, the peak flow timing error is increased from -1 days to -5 days.
Acknowledgement. The service is funded by the e-shape project. The e-shape project has received funding from the European Union’s Horizon 2020 research and innovation programme under grant agreement 820852 (e-shape 2021).
References
Burnash, R.J.C., 1995: The NWS river forecast system—catchment modeling. Computer Models of Watershed Hydrology, V.P. Singh, Ed., Water Resources Publications, 311–366, https://www.wrpllc.com/books/cmwhn.html.
Copernicus, 2021: Snow Water Equivalent. Copernicus Global Land Service, Accessed 17 December 2021, https://land.copernicus.eu/global/products/swe.
e-shape, 2021: Pilot 7.4 | Hydropower in snow reservoir – climate service. Accessed 17 December 2021, https://e-shape.eu/index.php/showcases/pilot7-4-hydropower-in-snow-reservoir-climate-service.
Finnish Meteorological Institute (FMI), 2021: Kemijoki Hydrological Forecasting System. Finnish Meteorological Institute, accessed 17 December 2021, https://hops.fmi.fi/.
Koren, V.I., M. Smith, D. Wang, and Z. Zhang, 2000: Use of Soil Property Data in the Derivation of Conceptual Rainfall-Runoff Model Parameters. Proc. 15th Conf. Hydrol. 2000, Long Beach, CA, Amer. Meteor. Soc., 103–106.
Rankinen, K., T. Karvonen, and D. Butterfield, 2004: A simple model for predicting soil temperature in snow-covered and seasonally frozen soil: model description and testing, Hydrol. Earth Syst. Sci., 8, 706–716, https://doi.org/10.5194/hess-8-706-2004.
HOW TO CITE THIS ARTICLE:
Ikonen J., C. Tanis, M. Kämäräinen, M. Kosmale, H. Poikela, and M. Strahlendorff, 2022: The Kemijoki Hydrological Forecast System – a service supporting hydropower production in Northern Finland, FMI’s Clim. Bull. Res. Lett., 4(1), 21–23, https://doi.org/10.35614/ISSN-2341-6408-IK-2022-07-RL.
CITATION INFORMATION:
Authors: Jaakko Ikonen, Cemal Tanis, Matti Kämäräinen, Miriam Kosmale, Heikki Poikela, Mikko Strahlendorff
Received: December 17, 2021
Accepted: May 31, 2022
First online: June 3, 2022
Published: September 2, 2022
Journal: FMI’s Climate Bulletin Research Letters
Volume: 4
Issue: 1
Pages: 21–23
DOI: https://doi.org/10.35614/ISSN-2341-6408-IK-2022-07-RL
This article is part of the e-shape Special Issue.
Header image: Albrecht Fietz, Pixabay