Based on Earth Observation and modelling data, climate indicators for urban regions can support sustainable urban planning, risk management and environmental protection. The current study demonstrates the development of climate services for major cities in Austria by providing climate projections on an urban scale. This approach focuses on heat indices and improves the data uptake by end users through standardizing modelling methodology, as well as formats, and facilitating data access. This enables quick visualization using data services of the Austrian national Climate Change Data Centre.
SANDRO OSWALD1, MAJA ZUVELA-ALOISE1, MICHAEL AVIAN1, CHRIS SCHUBERT2
1Zentralanstalt für Meteorologie und Geodynamik (ZAMG), Vienna, Austria
2Vienna University of Technology (TU Wien)
Urban Heat in Changing Climate. The local surface energy balance is altered in cities due to (i) high fraction of sealing and (high) building density as well as (ii) comparably low fraction of vegetation land cover. As a result, urban areas have higher ambient temperatures than rural ones, also known as the Urban Heat Island (UHI) effect (Landsberg 1981; Oke 1982). Due to the rising urbanization and growing fraction of sealed surfaces in total land use, temperature is increasing in urban areas. Hence, more and more people suffer during extreme heat waves as, e.g., in the summers of 2003 (García-Herrera et al. 2010) or 2015 (Urban et al. 2017). In order to counteract the negative effects of heat waves, which are expected to intensify even further in the future (IPCC 2013), and develop urban planning strategies for the mitigation of the UHI, detailed information on thermal conditions within a city is required, including possible development of heat extremes in the future.
Urban resilience to extreme weather. The European Commission implemented several climate services, such as the Copernicus Climate Change Service (C3S), providing climate indicators based on Earth Observation (EO) information and modelling data in order to support different types of end users and decision makers tackling the problems of climate change. In order to improve the user uptake of the EO data the H2020 project e-shape (EuroGEO Showcases: Applications Powered by Europe) aims to gather these EO resources in Europe and enhance the capabilities of existing European services in addressing different societal challenges. Furthermore, e-shape supports the coordinated exploitation of EO data and services through 27 cloud-based pilot applications in seven thematic areas, as well as the generation of information for these applications together with the users.
As part of e-shape, the showcase “Urban resilience to extreme weather” consists of three pilots with the goal to strengthen resilience and adaptive capacity to extreme weather in summer season on various timescales (e.g. from seasonal forecasts to climate projections). The pilot Climate projection products for Austrian cities, carried out by Austrian National Meteorological and Geophysical service (ZAMG), demonstrates the development of climate services for urban regions by creating climate projections for various Austrian cities. This is done by providing high spatial resolution climate information based on the EO data and modelling, focusing on heat indices. Data are made freely available on a national climate data platform (Climate Change Centre Austria (CCCA) data) to support urban planning, risk management and environmental protection. Thereby, the pilot follows the standardization of the method for urban climate modelling and its output to ensure a comparable modelling basis for other European cities.
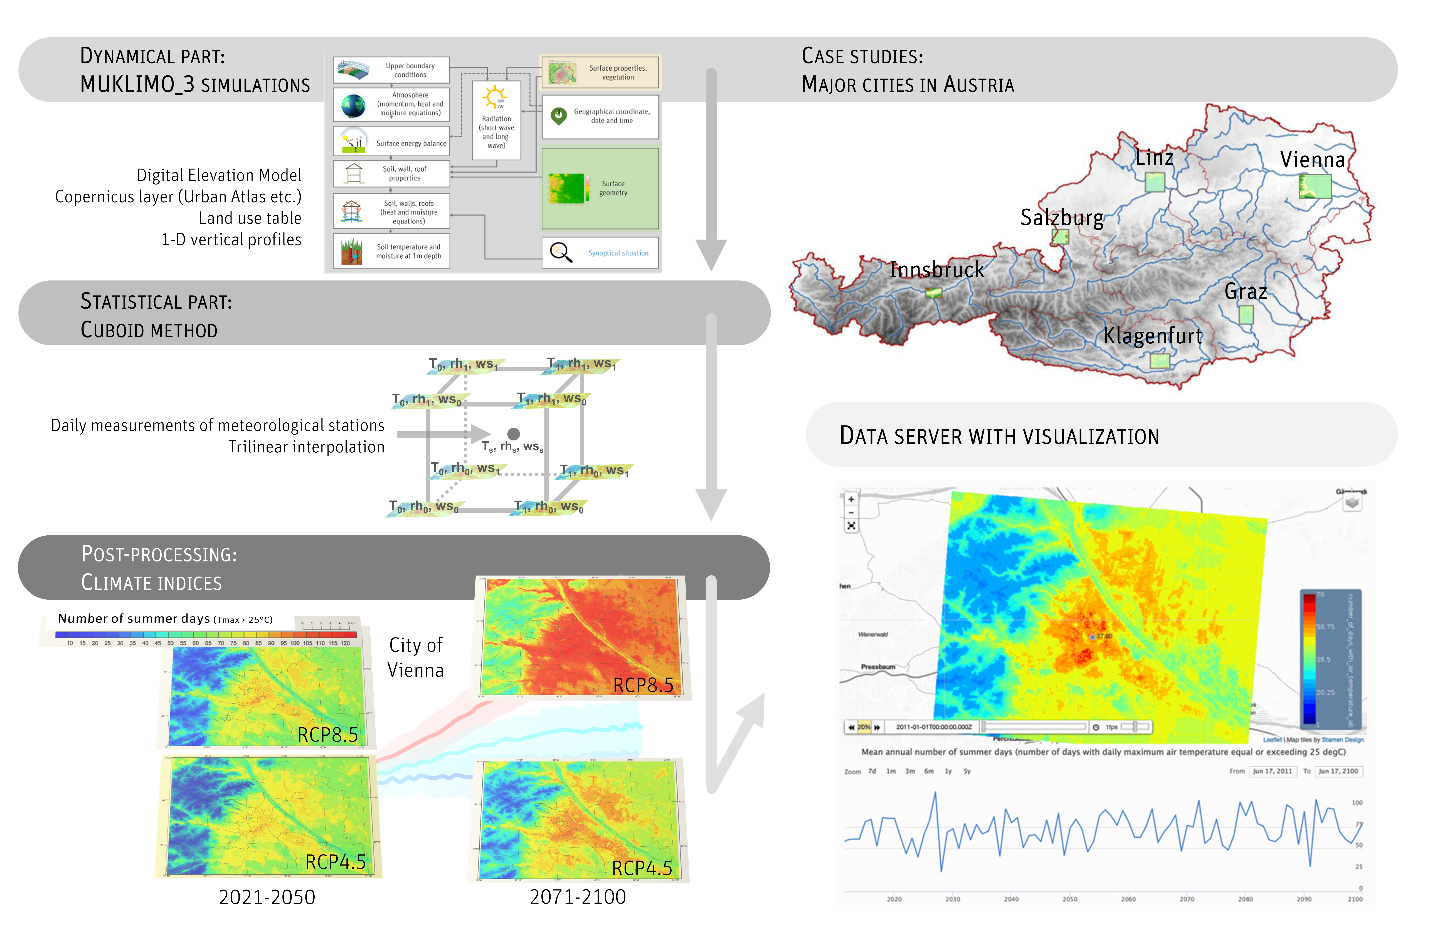
Urban climate model simulations. Within the cooperation with Germany’s National Meteorological Service (DWD), the ZAMG carried out urban climate model simulations with the MUKLIMO_3 model (Sievers 2016), which allows utilization of various satellite products of Copernicus services (e.g. Urban Atlas, tree cover density etc.) as input data to describe land surface distribution and properties. With the simulation of radiation, soil and atmospheric temperature, relative humidity, and wind flow in urban areas on a 3D grid (100 m spatial resolution, vertical resolution 10–100 m), the model provides the basis for evaluation of the (surface) temperature distribution within urban areas. In combination with meteorological measurements and regional climate model scenarios (representative for the background climate by applying the cuboid method (Früh et al. 2011; Žuvela-Aloise et al. 2018; Geletič et al. 2019)), the model can be used to derive several climate indices related to heat conditions such as the annual average number of summer days (days with maximum air temperature ≥ 25 °C). The regional climate model simulations from the EURO-CORDEX project (Jacob et al. 2014) provide information on meteorological variables until 2100 under various climate change scenarios, e.g., RCP4.5 and RCP8.5 (IPCC 2013). An ensemble of model output for different RCP scenarios is used to project future heat conditions in urban areas. In the pilot, eight different combinations of bias corrected regional/global climate model output were used to calculate climate indices for each year between 2011 and 2100 (Fig. 1).
Co-design of climate service and data uptake. In order to support urban planning and decision-making processes, urban climate projections and representation of climate information have been gaining importance among the researchers and stakeholders in recent years (e.g. de Wit et al. 2020). In case of urban resilience in Austria, continuous interaction between climate scientists, city administrations and urban planning experts have pointed out several key issues, which could improve the uptake of research results: (i) data accessibility, (ii) standardization of data formats, (iii) improved data quality with description of uncertainties, and (iv) easy data presentation. To tackle at least aspects i, ii, iv and provide data as a service regarding FAIR Guiding Principles (Wilkinson et al. 2016), the Climate projection products are curated by the CCCA data repository (CCCA 2015) as part of the Austrian research data infrastructure.
The urban climate projections data are distributed in the NetCDF format and follow the standards of NetCDF Climate and Forecast (CF) Metadata Conventions (CF-MC 2010) and Open Geospatial Consortium (OGC 2022) web services. The data collection for this pilot is available under e-shape (2022). The CCCA Data Centre enables an on-the-fly interactive data visualisation of NetCDF data with its server architecture, e.g. THREDDS Data Server (Fig. 1, bottom right). The user (registration required) can adapt and modify style parameters (e.g. colour scheme, portrayal) and the map design. More relevant is the on-demand processing. A time slider function allows to dive into different time scenarios and automatically creates a graph of the time series from 2011 until 2100 for a single spatial point. In addition, an integrated CCCA subset service (Schubert et al. 2019) allows for the creation and persistently republishing of any data fragments, filtered by an ”Area of Interest” or a specific time frame. Source code of these functionalities is provided as open source on Github (Github 2008).
Acknowledgements: We thank the European Commission H2020 project e-shape (grant agreement No. 82085) for their support. The German Meteorological Service (DWD) for providing the urban climate model MUKLIMO_3. The Climate Change Centre Austria for access to data services. We gratefully thank the cities of Vienna, Linz, Salzburg, Innsbruck, Graz, and Klagenfurt for providing diverse geo-information.
References
CCCA, 2011: Climate Change Centre Austria. Accessed 09 May 2022, https://data.ccca.ac.at.
CF-MC, 2010: Climate and Forecast (CF) Metadata Conventions. Accessed 09 May 2022, https://cfconventions.org.
e-shape 2022: e-shape Project-Urban resilience to extreme weather. Accessed 09 May 2022, https://data.ccca.ac.at/group/e-shape-urban-resilience-to-extreme-weather
Früh, B., and Coauthors, 2011: Estimation of climate-change impacts on the urban heat load using an urban climate model and regional climate projections. J. Appl. Meteor. Climatol., 50(1), 167–184, https://doi.org/10.1175/2010JAMC2377.1.
García-Herrera, R., J. Díaz, R. M. Trigo, J. Luterbacher, and E. M. Fischer, 2010: A review of the European summer heat wave of 2003. Critical Reviews in Environmental Science and Technology, 40(4), 267-306, https://doi.org/10.1080/10643380802238137.
Geletic, J., M. Lehnert, P. Dobrovolny, and M. Zuvela-Aloise, 2019: Spatial modelling of summer climate indices based on local climate zones: expected changes in the future climate of Brno, Czech Republic. Climatic Change, 152, 487–502, https://doi.org/10.1007/s10584-018-2353-5.
Github, 2008: CCCA-DC at GitHub Inc. Accessed 09 May 2022, https://github.com/ccca-dc/ckanext-thredds.
IPCC, 2013: Climate Change 2013: The Physical Science Basis. Contribution of Working Group I to the Fifth Assessment Report of the Intergovernmental Panel on Climate Change, Cambridge University Press, Cambridge, United Kingdom and New York, NY, USA, 1535 pp, https://doi.org/10.1017/CBO9781107415324.
Jacob, D., and Coauthors, 2014: EURO-CORDEX: new high-resolution climate change projections for European impact research. Reg. Environ. Change, 14, 563–578, https://doi.org/10.1007/s10113-013-0499-2.
Landsberg, H. E. (editor), 1981: The Urban Climate. Academic Press, 275 pp, ISBN: 9780080924199.
OGC, 2022: Open Geospatial Consortium. Accessed 09 May 2022, https://www.ogc.org/.
Oke, T. R., 1982: The energetic basis of the urban heat island. Quart. J. R. Met. Soc., 108, 1-24, https://doi.org/10.1002/qj.49710845502.
Schubert C., G. Seyerl, and K. Sack, 2019: Dynamic Data Citation Service—Subset Tool for Operational Data Management. Data, 4, 115, https://doi.org/10.3390/data4030115.
Sievers, U., 2016: Das kleinskalige Strömungsmodell MUKLIMO 3 Teil 2: Thermodynamische Erweiterungen. Berichte des Deutschen Wetterdienstes, 248, 151 pp, ISBN 978-3-88148-490-9, http://nbn-resolving.de/urn:nbn:de:101:1-201606173510 (pdf).
Urban, A., H. Hanzlíková, J. Kyselý, and E. Plavcová, 2017: Impacts of the 2015 heat waves on mortality in the Czech Republic—A comparison with previous heat waves. Int. J. Environ. Res. Public Health, 14, 1562, https://doi.org/10.3390/ijerph14121562.
Wilkinson, M., and Coauthors, 2016: The FAIR Guiding Principles for scientific data management and stewardship. Sci. Data, 3, 160018, https://doi.org/10.1038/sdata.2016.18
de Wit, R., and Coauthors, 2020: Supporting climate proof planning with CLARITY’s climate service and modelling of climate adaptation strategies–the Linz use-case. Urban Climate, 34, 100675, https://doi.org/10.1016/j.uclim.2020.100675.
Žuvela-Aloise, M., K. Andre, H. Schwaiger, D. N. Bird, and H. Gallaun, 2018: Modelling reduction of urban heat load in Vienna by modifying surface properties of roofs. Theor. Appl. Climatol., 131, 1005-1018, https://doi.org/10.1007/s00704-016-2024-2.
HOW TO CITE THIS ARTICLE:
Oswald S., M. Zuvela-Aloise, M. Avian, and C. Schubert, 2022: Future climate projection of heat indices for Austrian major cities: strengthening urban resilience and meeting user needs, FMI’s Clim. Bull. Res. Lett., 4(1), 24–26, https://doi.org/10.35614/ISSN-2341-6408-IK-2022-08-RL.
CITATION INFORMATION:
Authors: Sandro Oswald, Maja Zuvela-Aloise, Michael Avian, Chris Schubert
Received: November 29, 2021
Accepted: May 31, 2022
First online: June 3, 2022
Published: September 2, 2022
Journal: FMI’s Climate Bulletin Research Letters
Volume: 4
Issue: 1
Pages: 24–26
DOI: https://doi.org/10.35614/ISSN-2341-6408-IK-2022-08-RL
This article is part of the e-shape Special Issue.
Header image: Adobe Stock