In densely forested countries such as Finland, windstorms are among the most significant natural hazards, causing the widest damages for society in the form of power outages, damages to forest and property, emergency tasks and traffic delays. In this paper we describe the impacts of windstorm Aila in September 2020.
ILONA LÁNG, ANTTI MÄKELÄ, PAAVO KORPELA, HILPPA GREGOW
Finnish Meteorological Institute
Most of the intense windstorms occur typically during late autumn and winter (October-March), while strong windstorms in September are less common. Regarding wind speed (maximum average wind speed 29.4 m/s), Aila was the strongest windstorm occurring in September in the past 20 years (Gregow et al. 2021; FMI 2020). With respect to impacts, Aila’s return period is around 5–10 years. In this paper, we discuss the level of preparedness and present some of the main societal impacts of Windstorm Aila occurring on the 16–17 September 2020. Regarding the analysis of the forecast and the climatological aspect of this storm, please see other articles in this Research Letter issue.
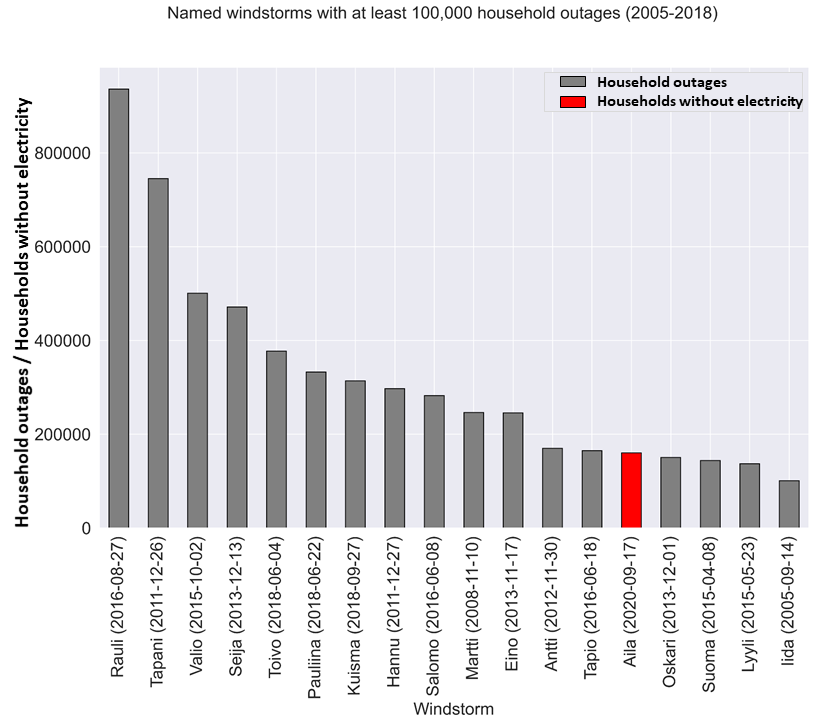
In total, the society was well-prepared for windstorm Aila. The issued warnings were on the highest possible level (red) as early as three days before windstorm Aila arrived in Finland and for the first time the national 112-mobile application was used to distribute warning messages to inform citizens on severe weather. As part of their responsibilities before a significant windstorm, the duty forecasters include a brief impact estimation in the so called LUOVA[1] weather bulletin (FMI 2016). During Aila, the issued LUOVA bulletin estimated the impacts to reach at least 100,000 power outages nationally, which means a significant storm for the energy sector. Regarding the overall socioeconomic impacts, the preliminary estimation showed that windstorm Aila ranked high among the past two decades’ windstorms (Fig. 1), however the impacts for different sectors varied. For instance, the power outage amounts of windstorm Aila (~160,000 households without electricity) are comparably standard for this magnitude of storm, however the number of emergency tasks during Aila (nearly 3,000) reached the second highest place in the record. The good predictability of windstorm Aila in combination of precise warnings and effective communication for the authorities and public resulted in one of the decade’s strongest storms being handled reasonably well in the Finnish society.
The environmental conditions during the late summer and early autumn increase the risk of extensive forest damages as the soil is unfrozen and trees have leaves, which both make trees fall easier during a storm (Valta et al. 2019). In addition, during windstorm Aila, the soil was wet on wide areas in Central Finland because of an exceptionally rainy September (rain accumulation until mid-September was 50–100 mm). As Kamimura et al. (2012) state, also wet soil influences the wind damage and decreases the tree anchorage to the ground. All these factors, together with strong wind gusts of Aila, favored it to become a significant windstorm regarding the impacts.
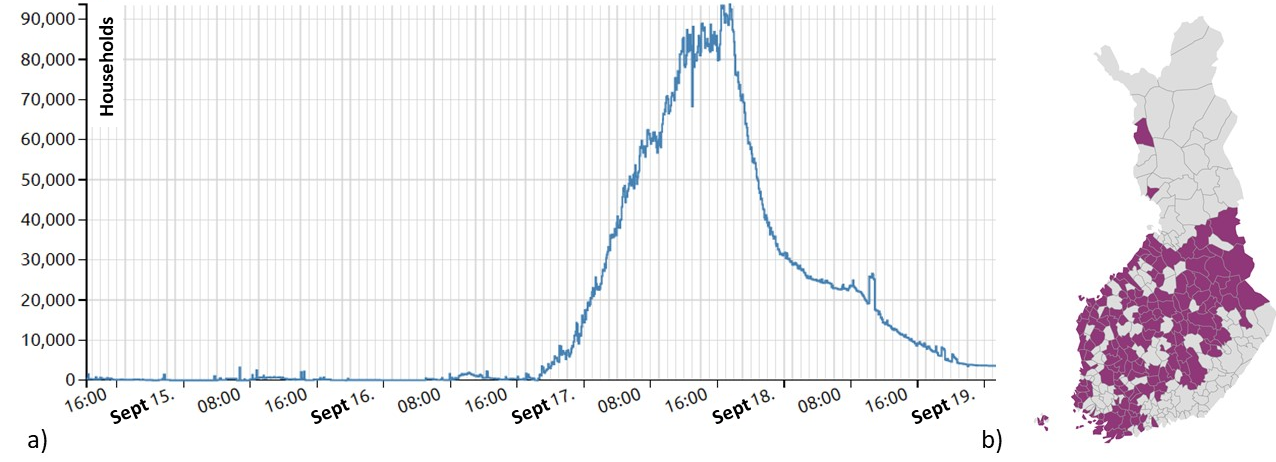
Energy. The number of households left without electricity started to increase from the evening of 16th Sep, reaching the peak (>90 000 customers without electricity simultaneously) in the evening on 17th Sep and decreased below 10 000 about 24 hours later (Fig. 2a). Nearly 200 municipalities were affected by the storm (Fig. 2b). The impacts on electricity grids were considerable (see Fig. 1), but not as massive as they could have been, taking into account the magnitude and unusual timing of the windstorm. Preliminary examination suggests that less faults occurred in the regions with more ground-cabling compared to air transmission lines. The strongest wind gusts hit the western part of the country where a big share of the power grid is already underground, compared to the eastern part of the country where for example windstorm Rauli hit with full power (Fig. 1). In addition, at the time of windstorm Rauli in 2016, only 35.6 % of the national power grid was underground and in 2019 the percentage of ground cabling was already 44.7 %. This shows that Finland is investing in improving the preparedness for storms and in windstorm cases as Aila, the investment also seems to pay off.
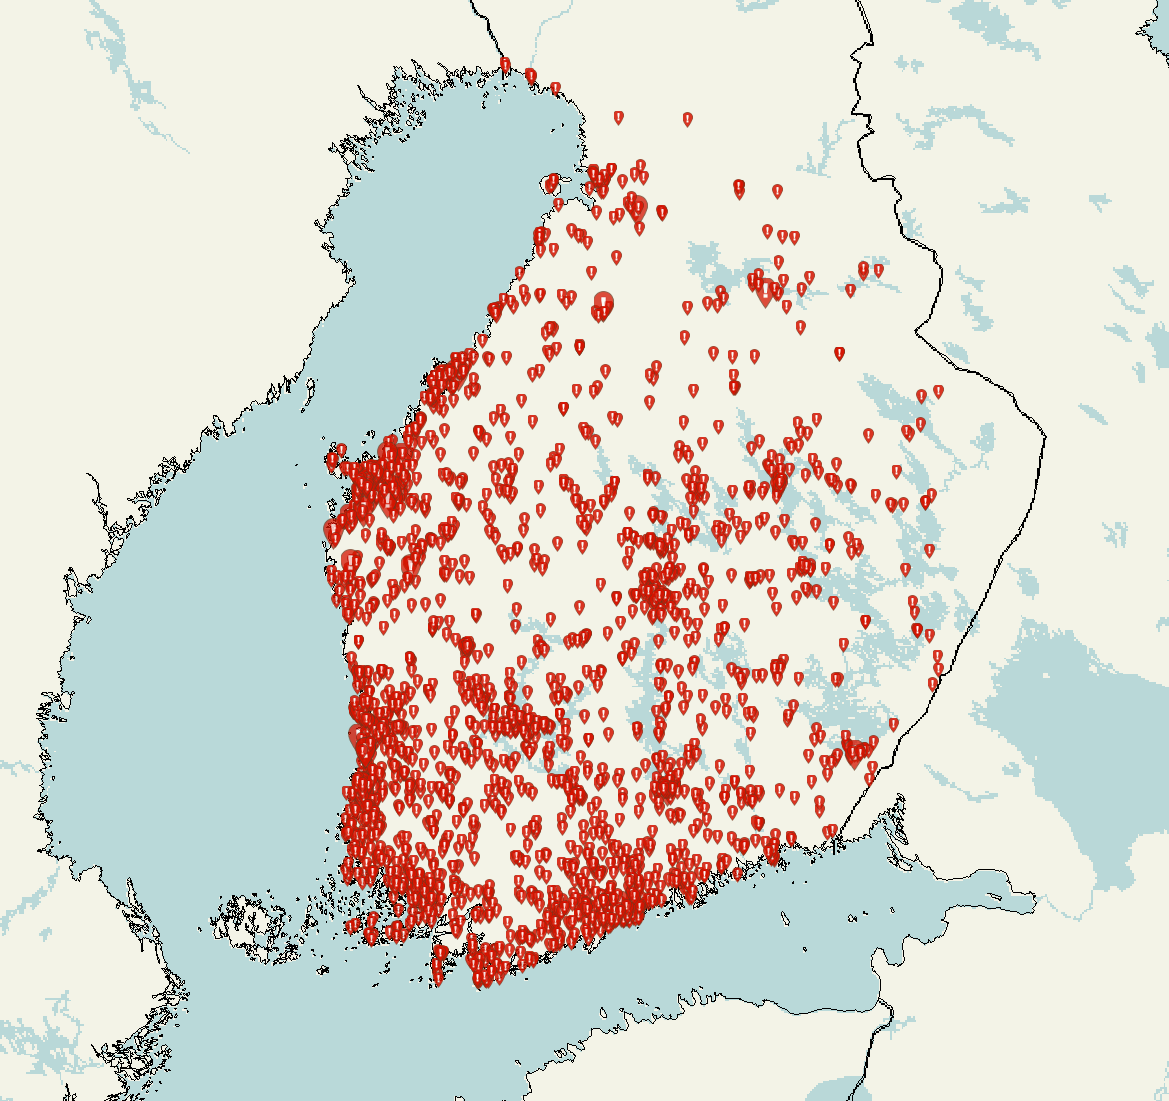
Emergency services. Regarding emergency tasks, Aila was ranked to be the third busiest windstorm day for emergency services with 2950 emergency tasks during 48 hours (Fig. 3) (the final emergency task numbers might change once the data is consolidated). Windstorm Tapani (2011), known also as Cyclone Dagmar (Kufeoglu and Lehtonen 2014), has the highest number of emergency tasks (5800; Table 1), and windstorm Janika (2001) being close to Tapani’s impacts, however the impact observations are less reliable and therefore left out of the comparison of this article. Regarding emergency tasks, Aila stands closest to windstorm Rauli’s impacts (2200; Table 1). The spatial occurrence of emergency call tasks (Fig. 3) indicates the largest density of rescue tasks in general in the coastal areas, in the regions of the strongest wind gusts and in the areas with highest population (cities). In the morning of the 17th of Sep, the emergency tasks were rapidly increasing especially in the western and southwestern Finland but during the course of the day, more emergency tasks started to occur in southern Finland as well. Eastern and northern parts of the country remained with less damage since the storm was weakening while moving eastwards. In total, no casualties related to the storm were reported.
| Indicator/ Storm (Month, Year) | Aila (Sep, 2020) | Rauli (August, 2019) | Lyyli (May, 2015) | Valio (Oct, 2015) | Eino (Nov, 2013) | Seija (Dec, 2013) | Tapani (Dec, 2011) |
|---|---|---|---|---|---|---|---|
| Damaged forest (Mm³) | ~0.4–0.7 | ~0.1–0.2 | 0.1–0.2 | 0.5–1.5 | 1.5 | ~1 | 3 |
| Emergency tasks | ~3000 | 2200 | ~500 | 1600 | 1800 | 2100 | 5800 |
| Max gust, inland (m/s) | ~30 | 23 | 24 | 26 | 27 | 30 | 32 |
| Soil frost | no | no | partly | no | no | partly | no |
| Leaves on trees | yes | yes | partly | no | no | no | no |
Other impacts. The Finnish Forest Center estimated that the storm did not cause large-scale forest damages, but mostly scattered and smaller damages especially in the southern borders of open areas. The total estimated amount of fallen trees was 0.4 to 0.7 million m3 equal to 15–20 million Euros. Furthermore, one fallen tree in Tampere caused the whole railroad system to cease between Tampere and Helsinki.
Overall, Aila’s ranking is among the strongest windstorms of the 2000s with respect to the impacts. This study highlights the importance of efficient early-warning measures to mitigate the storm impacts, especially related to human safety and critical infrastructure.
Acknowledgements: We thank ERA4CS for the WINDSURFER project.
[1]LUOVA is an official warning report of FMI tailored for authorities which spreads information on natural hazards nationally and globally.
References
Finnish Energy, 2020: The power outage map. Accessed 18 September 2020, https://www.sahkokatkokartta.fi/.
FMI, 2020: Tuulitilastot. Accessed 18 September 2020, https://www.ilmatieteenlaitos.fi/tuulitilastot.
FMI, 2016: LUOVA answers the authorities’ need for information when a natural disaster occurs, https://en.ilmatieteenlaitos.fi/news/286502165.
Gregow, H., et al., 2021: Windstorm Aila 2020: wind forecasts and discussion on climate change, FMI’s Clim. Bull. Res. Lett., [preprint], https://doi.org/10.35614/ISSN-2341-6408-IK-2021-04-RL.
Kamimura, K., et al., 2012: Root anchorage of hinoki (Chamaecyparis obtuse (Sieb. Et Zucc.) Endl.) under the combined loading of wind and rapidly supplied water on soil: analyses based on tree-pulling experiments, Eur. J. Forest Res., 131, 219–227, https://link.springer.com/article/10.1007%2Fs10342-011-0508-2.
Kufeoglu, S., and Lehtonen, M., 2014: Cyclone Dagmar of 2011 and its impacts in Finland, IEEE PES Innovative Smart Grid Technologies Conference Europe, 10.1109/ISGTEurope.2014.7028868.
Láng, I., et al., 2021: Investigating extra-tropical storm impacts on electricity grids by classifying 83 storms in Finland, in review.
Valta, H., et al., 2019: Communicating the amount of windstorm induced forest damage by the maximum wind gust speed in Finland. Advances in Science & Research, 16, 31–37, https://doi.org/10.5194/asr-16-31-2019.
HOW TO CITE THIS ARTICLE:
Láng I., Mäkelä A., Korpela P., and Gregow H., 2021: Windstorm Aila 2020: societal impacts, FMI’s Climate Bulletin: Research Letters, 3(1), 15–17, DOI: https://doi.org/10.35614/ISSN-2341-6408-IK-2021-05-RL
CITATION INFORMATION:
Authors: Ilona Láng, Antti Mäkelä, Paavo Korpela, and Hilppa Gregow
Received: September 22, 2020
Accepted: April 19, 2021
First online: April 29, 2021
Published: June 24, 2021
Corrected: August 2, 2021
Journal: FMI’s Climate Bulletin: Research Letters
Volume: 3
Issue: 1
Pages: 15–17
DOI: https://doi.org/10.35614/ISSN-2341-6408-IK-2021-05-RL
Header image: Abobe Stock