In this study, 13 bias corrected GCMs are divided into groups of high and low climate sensitivity and both groups’ projected precipitation changes are studied separately. It is shown that yearly precipitation increases much more with high climate sensitivity models.
JANI RÄIHÄ
Finnish Meteorological Institute
Global climate models (GCMs) from the Coupled Model Intercomparison Phase 5 (CMIP5; van Vuuren et al., 2011) can be grouped by their sensitivity to feedback mechanisms such as water vapour and clouds; they are accordingly categorized into high climate sensitivity (HS) and low climate sensitivity (LS) models. Higher sensitivity to feedback mechanisms results in more pronounced changes in temperature and precipitation in the future climate (Mauritzen et al., 2017). Sherwood et al. (2014) found that HS models are more consistent with observations than LS models.
This study uses simulation results of precipitation from 13 GCMs under the RCP8.5 scenario (Riahi at al., 2011). There are five HS models: CanESM2, GFDL-CM3, IPSL-CM5A-MR, MIROC-ESM, MRI-CGCM3, and eight LS models: MIROC5, CCSM4, MPI-ESM-MR, CNRM-CM5, EC-EARTH, BCC-CSM1-1, NorESM1-M and GFDL-ESM2M. GCMs were downscaled following method 8 (M8), empirical quantile mapping bias correction method (Räty et al., 2014), conducted separately for each calendar month in 1981–2010 (baseline period) and 2071–2100 (projection period). Observed precipitation data for downscaling was provided in a 10 km x 10 km grid resulting from a kriging-interpolation procedure (Aalto et al., 2016).
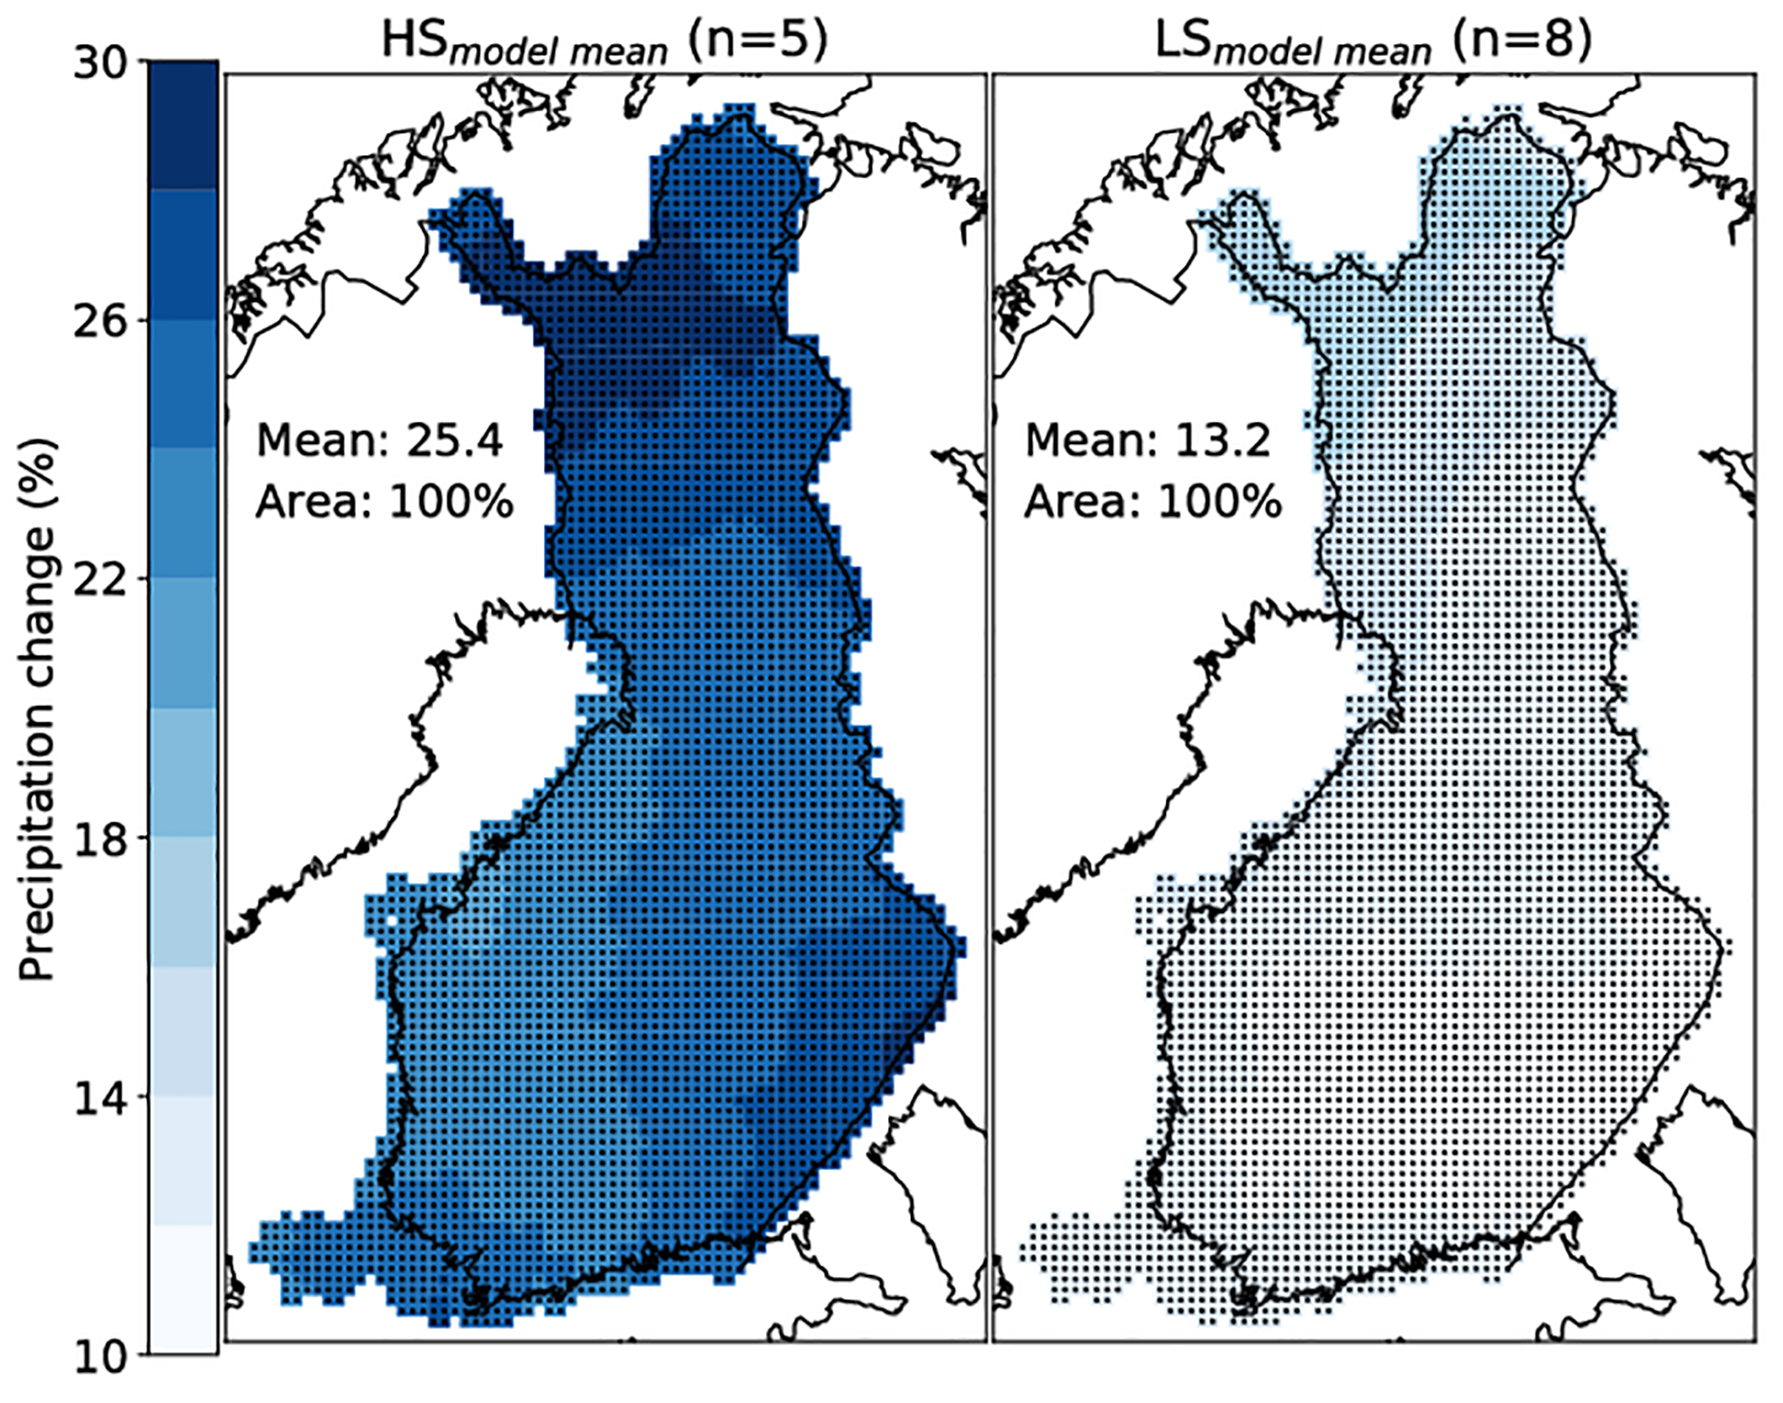
There is a clear difference between HS and LS models in the magnitude of precipitation change from 1981–2010 to 2070–2100 (Fig. 1). HS models show an average relative change of +25% ranging from about +20% to +30%, while LS models reveal an average increase of only 13% ranging from 10% to 18%. Changes are statistically significant in all of Finland for both HS and LS.
This study shows that climate sensitivity differences in GCMs have a large effect on the magnitude of projected precipitation changes in Finland. For some impact studies it might be useful to treat HS and LS models separately as Mauritzen et al. (2017) proposes.
Acknowledgements: I would like to thank Kimmo Ruosteenoja and Matti Kämäräinen from FMI for providing data and computer code that made this study possible.
References
Aalto, J. et al., 2016: New gridded daily climatology of Finland: Permutation-based uncertainty estimates and temporal trends in climate. Journal of Geophysical Research: Atmospheres, 121, 3807–3823.
Mauritzen C. et al., 2017: On the relationship between climate sensitivity and modelling uncertainty. Tellus A: Dynamic Meteorology and Oceanography, 69, 1327765.
Riahi, K. et al., 2011: RCP 8.5—A scenario of comparatively high greenhouse gas emissions. Clim. Chang., 109, 33–57.
Räty, O. et al., 2014: Evaluation of delta change and bias correction methods for future daily precipitation: intermodel cross-validation using ENSEMBLES simulations. Clim. Dynam., 42, 2287–2303.
Sherwood, S. C. et al., 2014: Spread in model climate sensitivity traced to atmospheric convective mixing. Nature, 505, 37–42.
van Vuuren, D. P. et al., 2011: The representative concentration pathways: an overview. Clim. Chang., 109, 5–31.
HOW TO CITE THIS ARTICLE:
Räihä J., 2019: Do high and low climate sensitivity GCMs show differences in projected precipitation changes in Finland?, FMI’s Climate Bulletin: Research Letters, 1(1), 13, DOI: 10.35614/ISSN-2341-6408-IK-2019-11-RL
CITATION INFORMATION:
Authors: Jani Räihä
Received: March 28, 2019
Accepted: May 14, 2019
First online: June 19, 2019
Published: June 20, 2019
Journal: FMI’s Climate Bulletin: Research Letters
Volume: 1
Issue: 1
Page: 13
DOI: 10.35614/ISSN-2341-6408-IK-2019-11-RL
Header image: Eija Vallinheimo