To be able to tailor extreme wind information in order to address the needs of various end-users, a synthesised understanding summarizing these needs is required. In this article we summarize the user needs for extreme wind information in the forestry, insurance and offshore energy sectors. For the offshore energy, wave risk information needs are also included.
ARI VENÄLÄINEN1, ILARI LEHTONEN1, MIKKO LAAPAS1, HILPPA GREGOW1, LEN SHAFFREY2, ØYVIND BREIVIK3,4, PAULA CAMUS5
1Finnish Meteorological Institute
2Reading University
3Norwegian Meteorological Institute
4University of Bergen
5IH Cantabria
Extreme winds pose major risks to life, property and forestry, while extreme ocean waves can impact on offshore infrastructures and coastal communities. In the ERA4CS project “WIND and wave Scenarios, Uncertainty and climate Risk assessments for Forestry, Energy and Reinsurance” (WINDSURFER), the consortium partners have co-developed new methods, tools and assessments of extreme wind and wave risk with a focus on the selected three key sectors: insurance, forestry and offshore energy. This article summarizes the user needs identified in the project for extreme wind information in these three key sectors. For the offshore energy, wave risk information needs are also included.
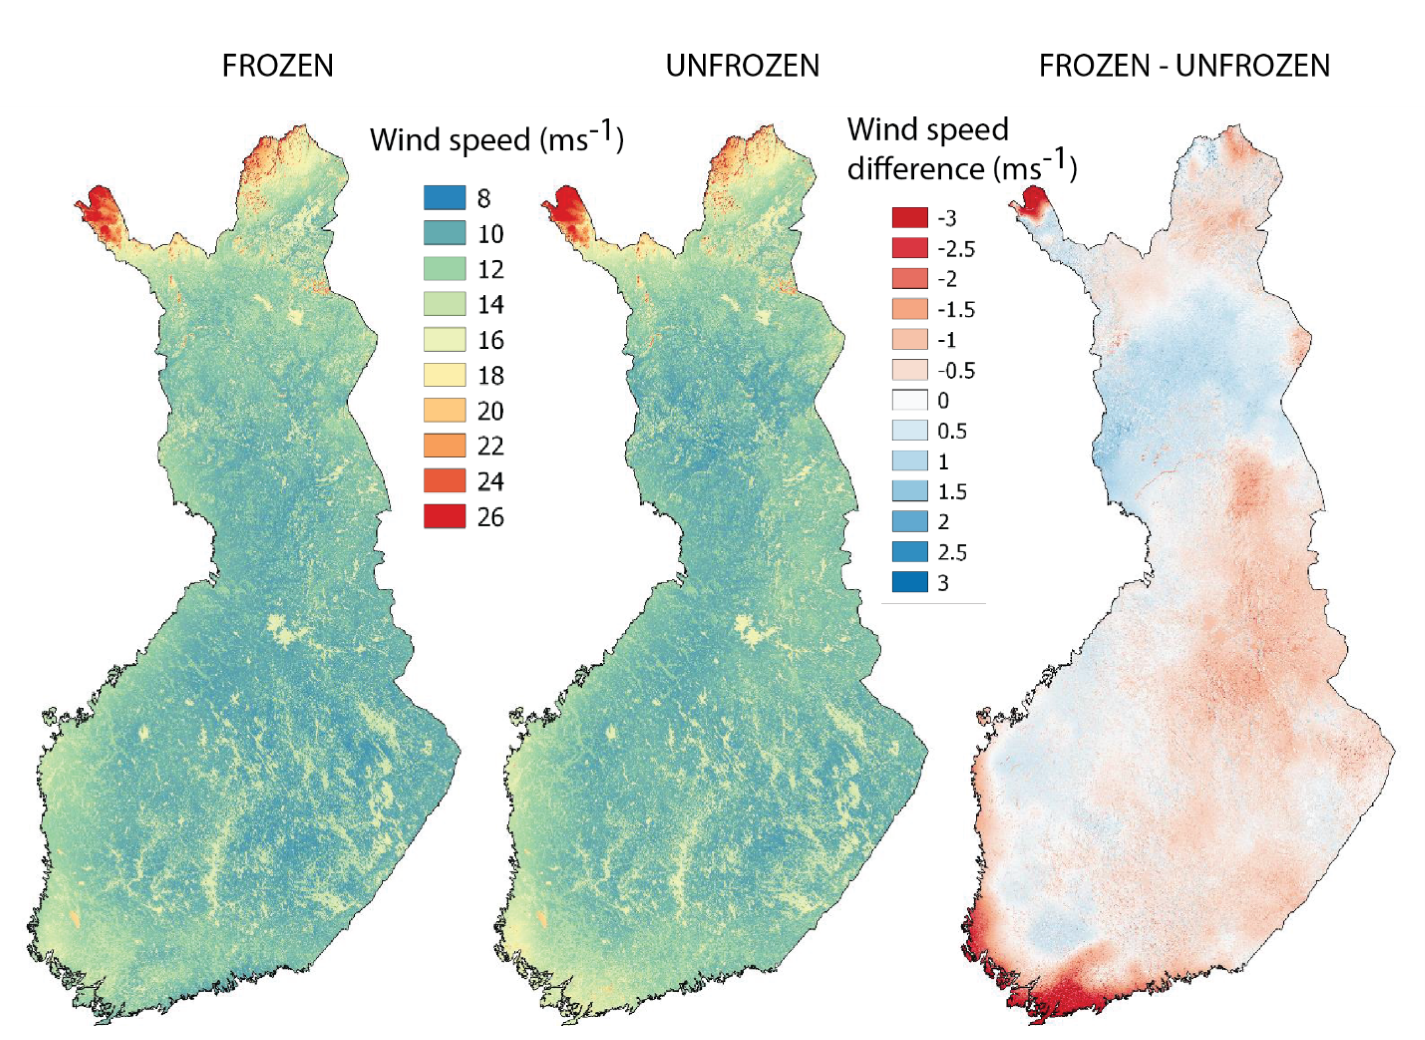
Forestry. Wind is the dominant abiotic cause of forest damages in Europe (Seidl et al. 2014; Reyer et al. 2017; Gregow et al. 2017). The mapping of user needs for the forestry sector was done as an outcome of a stakeholder workshop that was held as a part of the project “Sustainable, climate-neutral and resource-efficient forest-based bioeconomy” (FORBIO) (https://www.uef.fi/web/forbio). The identified forestry sector’s needs for meteorological and climate data consists of: a) forecasts and warnings which include information on sustained and gust wind speed and wind direction with spatial resolution of EU NUTS 3 (https://ec.europa.eu/eurostat/web/nuts/background) or higher. Forecasts should: a) contain information about the reliability (skill) of the forecast, b) an estimate about the possible magnitude of damage caused by the (forecasted) storm, c) climate scenarios that cover both near future and extend until the end of this century, and include information on the possible change in extreme wind speeds and possible change of prevailing wind direction, d) climate scenarios should include information also on other factors such as soil frost and soil wetness which influence wind throw risk, e) information on the occurrence, frequency and strength of past storms during the recent decades and openly available high spatial resolution GIS datasets, for example, depicting 10-year return level of maximum wind speed under frozen and unfrozen soil conditions (Fig. 1). The skill of forecast varies from a weather condition to another. In item a) mentioned needs to have an estimate about the forecast skill that can be understood and that the forecaster includes it into the forecasts an estimate about the possibility to make accurate forecasts under the prevailing weather conditions.
Insurance sector. The damage to infrastructure, property and life from damaging windstorms still account for the largest sources of insurance loss in Europe. For example, the three windstorms (Anatol, Lothar, Martin) that struck in Dec 1999 inflicted €18 billion of insured losses to property and infrastructure across Europe. To better assess the risks from European Windstorms, the insurance sector requires improved information to assess windstorm risk. The results for the insurance sector are based on the understanding gained in the Copernicus Climate Change Services (C3S) SECTEUR project on user needs for Climate Services. For insurance, the primary need for information is for European Windstorm risk, especially spatial maps of maximum wind gusts for major historical storms. This is for assessing wind damage and/or for evaluating industry pricing models (known as ‘catastrophe models’). There is a growing need for information on climate change and insurance risk, which is largely driven by financial regulators (such as the Bank of England for the London market).
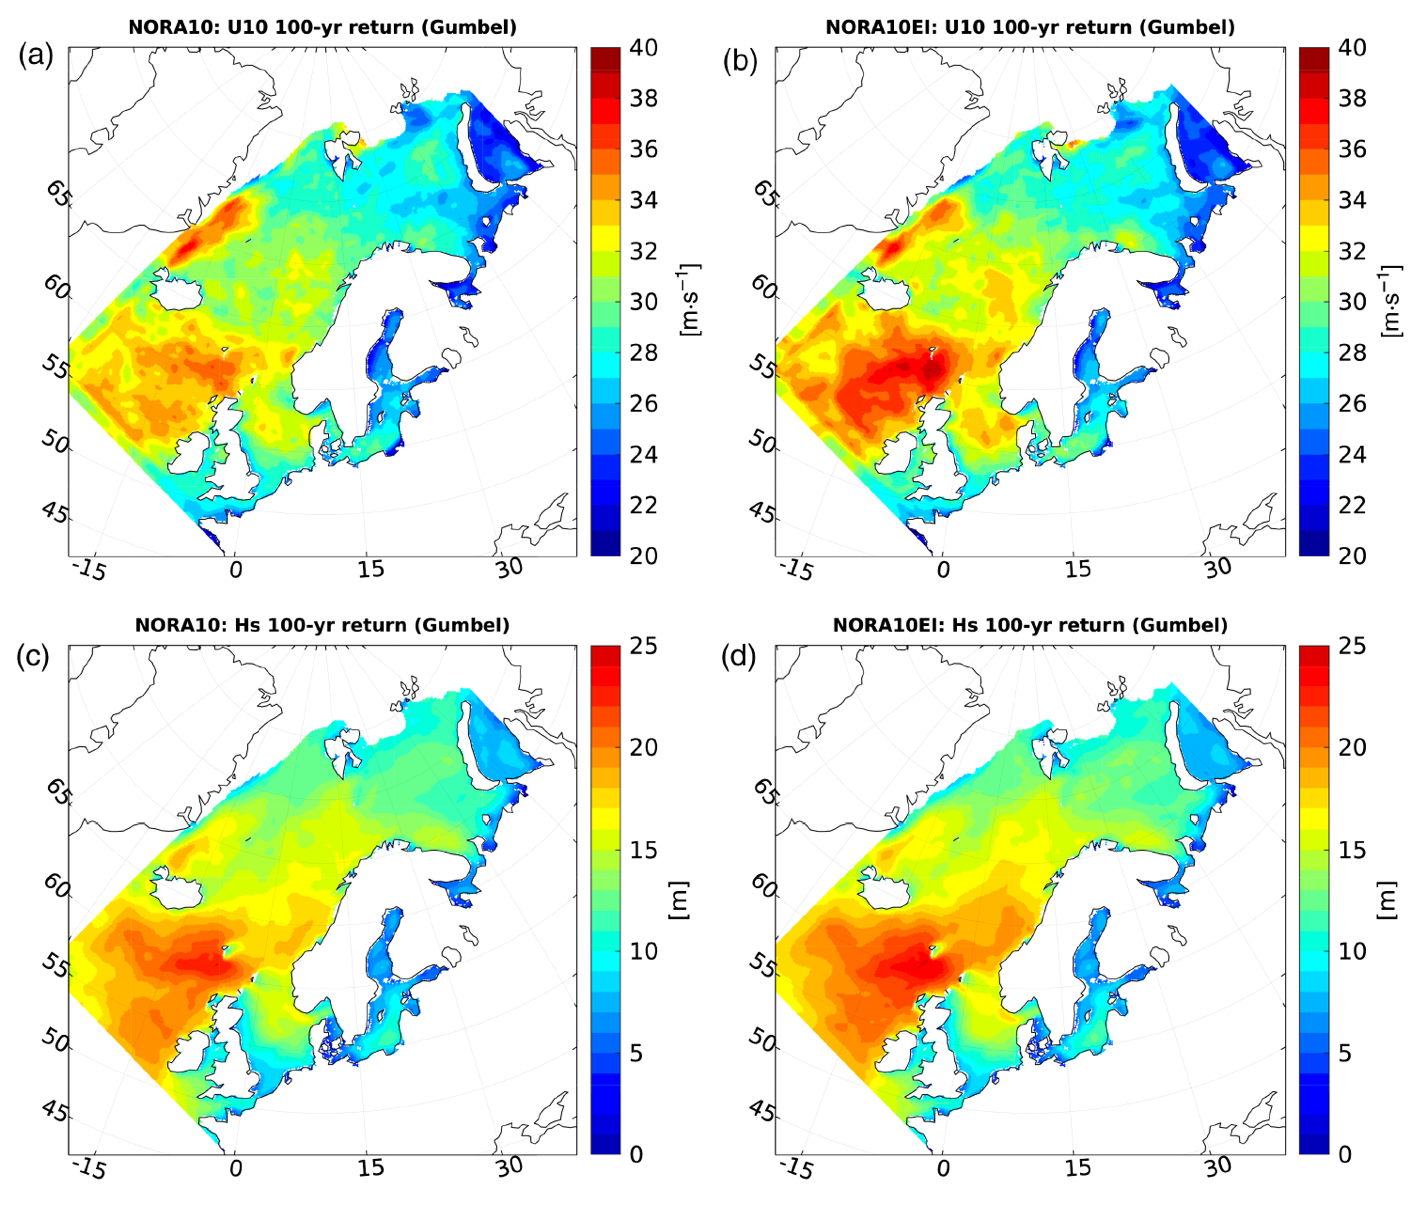
Energy sector and offshore infrastructures. Extreme waves driven by strong winds can have substantial impacts on the energy sector and offshore infrastructures. For example, a windstorm on 12 December 1990 generated a significant wave height of about 12 m in the central North Sea (close to the 100-year return level), causing extensive damage on the Ekofisk platforms. Estimating the probabilities of extreme wind and wave events requires observations to be supplemented or combined with atmospheric and wave models, such as the recently completed NORA10EI wind and wave hindcast (see Fig. 2, from Haakenstad et al., 2020). Here we compare the 100-year return values of NORA10EI (Haakenstad et al., 2020) with the older NORA10 hindcast (Reistad et al., 2011), the former funded by WINDSURFER. NORA10EI uses ERA-Interim on the boundaries for consistent forcing (Dee et al., 2011). The differences are generally quite modest, except for the region south of the Faroe Islands (where the 100-year return estimate of the wind speed is 5 m s-1 higher), but it is clear that the choice of boundary and initial conditions can significantly influence the return values from high-resolution hindcasts. In the case of offshore energy, return levels of extreme events with very low probabilities (long return periods) are essential information. Regulators and owners require consideration of 1,00-year to 10,000-year events. Hindcasts and reanalyses are useful for these calculations as the relatively short observational time series available hinder calculation of robust estimates for such extreme events. One can also consider using simulated cases, e.g. a large ensemble of climate model simulations to expand the available amount of data (Breivik et al., 2014, Meucci et al., 2018).
Acknowledgements: We thank Strategic Research Council of the Academy of Finland project Forbio (project number 314224), and the ERA4CS Windsurfer project. ØB is grateful to Equinor for additional funding of the offshore hindcast archives
References
Breivik, Ø., et al., 2014: Wind and Wave Extremes over the World Oceans From Very Large Ensembles, Geophys. Res. Lett., 41(14), DOI: https://doi.org/10.1002/2014GL060997
Dee, D., et al., 2011: The ERA-Interim reanalysis: Configuration and performance of the data assimilation system, Q. J. R. Meteorol. Soc., 137(656), DOI: https://doi.org/10.1002/qj.828
Gregow, H., et al., 2017: Increasing large scale windstorm damage in Western, Central and Northern European forests, 1951-2010, Scientific Reports, 7, 46397, DOI: https://doi.org/10.1038/srep46397
Haakenstad, H. et al., 2020: NORA10EI: A revised regional atmosphere-wave hindcast for the North Sea, the Norwegian Sea and the Barents Sea, Int. J. Climatol., DOI: https://doi.org/10.1002/joc.6458
Laapas, M., et al., 2019: The 10-year return levels of maximum wind speeds under frozen and unfrozen soil forest conditions in Finland. Climate, 7, 62, DOI: https://doi.org/10.3390/cli7050062
Meucci, A., et al., 2018: Wind and Wave Extremes from Atmosphere and Wave Model Ensembles, J. Climate, 31(21), DOI: https://doi.org/10.1175/JCLI-D-18-0217.1
Reistad, M., et al., 2011: A high-resolution hindcast of wind and waves for the North Sea, the Norwegian Sea, and the Barents Sea, J. Geophys. Res., 116, DOI: https://doi.org/10/fmnr2m
Reyer C., et al., 2017: Are forest disturbances amplifying or cancelling out climate change-induced productivity changes in European forests? Environ. Res. Lett., 12, 034027, DOI: https://doi.org/10.1088/1748-9326/aa5ef1
Seidl, R., et al., 2014: Increasing forest disturbances in Europe and their impact on carbon storage. Nature Clim. Change, 4(9), 806–810, DOI: https://doi.org/10.1038/nclimate2318
HOW TO CITE THIS ARTICLE:
Venäläinen A., Lehtonen I., Laapas M., Gregow H., Shaffrey L., Breivik Ø., and Camus P., 2020: User needs for extreme wind information in the forest, insurance and offshore energy sectors, FMI’s Climate Bulletin: Research Letters, 2(1), 8–9, DOI: https://doi.org/10.35614/ISSN-2341-6408-IK-2020-03-RL
CITATION INFORMATION:
Authors: Ari Venäläinen, Ilari Lehtonen, Mikko Laapas, Hilppa Gregow, Len Shaffrey, Øyvind Breivik, and Paula Camus
Received: February 28, 2020
Accepted: April 30, 2020
First online: May 19, 2020
Published: May 25, 2020
Journal: FMI’s Climate Bulletin: Research Letters
Volume: 2
Issue: 1
Pages: 8–9
DOI: https://doi.org/10.35614/ISSN-2341-6408-IK-2020-03-RL
This article is part of the ERA4CS Special Issue.
Header image: Bengt Wikström