The most severe weather warnings are not given lightly, but when they are, everyone should take care and act. This case study presents warnings, forecasts and observations during Storm Aila 16–17 September 2020 in Finland and compares it to the past windstorms. It demonstrates why weather and climate change knowledge should be seamlessly presented to improve our understanding of possible impacts of climate change on storms in Finland.
HILPPA GREGOW, TERHI K LAURILA, MIKA RANTANEN, EERIK SAARIKALLE, ILONA LÁNG, CARL FORTELIUS
Finnish Meteorological Institute
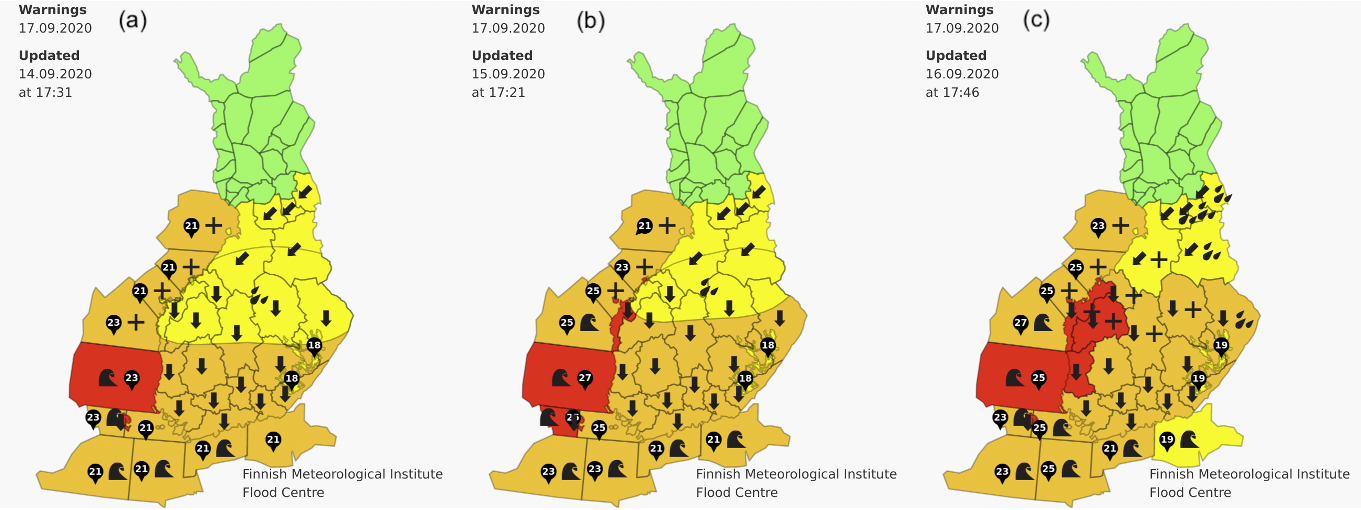
Preparing for the storm. In mid-September 2020, we were preparing our society for potential storm impacts by increasing communication in the social media and by official communication means. The strongest warnings were issued already on 14 September 2020 about an extreme windstorm that would cause abundant rain and extreme northerly storm winds in Finland on 16–17 September 2020. The storm was named as Aila. Meteorologists of the Finnish Meteorological Institute (FMI) also used Twitter to give constant updates of the maximum wind speed and heavy precipitation forecasts. The highest red-level warnings for wind gusts and rough waves were issued as early as three days before Storm Aila arrived. In the following days, the highest-level warnings were further extended to also cover land areas (Fig. 1). Insurance companies informed about typical consequences of a storm of this magnitude and how one can be prepared before and after the storm, especially if damages have materialized. For instance, the following actions were listed: take care of pipes outside to let the water run freely; check the condition of your property; make sure you know how to cut off electricity if the storm has caused damage to wires; remove such trees from your yard that are at risk to fall before the storm; move any items that may fly away in the air; after the storm, take photos of the damages and then cover the property to avoid creation of further damage; ask support from the rescue services if the damages are extensive.
Forecast validation. To validate the forecasts, the wind speed and wind gust predictions from MetCoOp Enemble Prediction System (MEPS) were compared with the wind observations. MEPS is a short-range convection permitting limited area ensemble prediction system based on the HARMONIE-AROME weather model (Bengtsson et al. 2017). It has a horizontal resolution of 2.5 km and it produces forecasts with 66 h lead time. At the lateral edges of its domain, MEPS uses information from a global medium to extended-range ensemble prediction system (IFSENS) which has 18 km horizontal resolution and is based on the Integrated Forecast System (IFS) and operated by the European Centre for Medium-Range Weather Forecasts (ECMWF). MEPS is jointly operated by the FMI, the Swedish Meteorological and Hydrological Institute (SMHI) and the Norwegian Meteorological Institute (Met Norway) and the Estonian Weather Service (ENVIR).
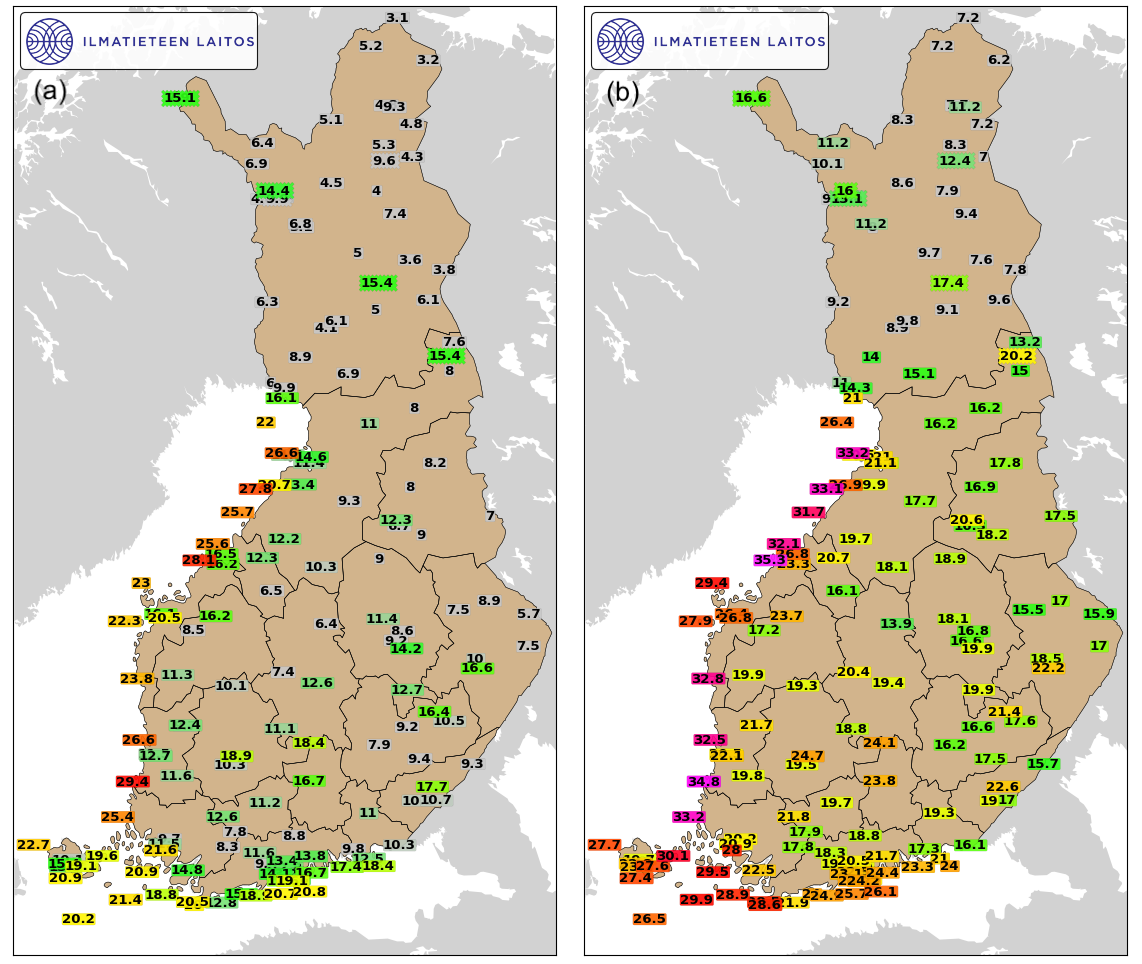
When comparing MEPS wind gusts (Fig. 2) to observations (Fig. 3) it turned out that the forecasts were rather good in the heavily impacted areas in Western Finland. Difficulties in forecasting the magnitude and severity of the storm occurred in the southeast during the time when the cyclone movement was slowing down. As MEPS was not the only forecast model in use, the meteorologists succeeded in their warnings by interpreting MEPS and the other models based on their experience. For example, the forecasts based on the IFS model predicted the formation of Storm Aila very well (Rantanen et al. 2021). The highest observed 10-min sustained wind speed was 29.4 m/s (Rauma Kylmäpihlaja; Fig. 3a) and the highest wind gust was 35.3 m/s (Pietarsaari Kallan; Fig. 3b).

Comparison to past storm events. October to March is the typical time window for occurrence of extreme extratropical cyclones and storm winds in Finland (FMI 2021). In the current storm severity classifications starting from 1994 in Finland, a storm with maximum 10-min sustained wind speeds of 29 m/s or above is considered severe. Such windstorms occur in Finland around every fourth year on average. Windstorms in September are less common and have not reached this category in Finland over the coastal areas before 2020. Additionally, only one of the past September windstorms, post-tropical storm Mauri in 1982 (Laurila et al. 2020), has been a severe one, as regards impacts. While Storm Mauri had tropical origins (Laurila et al. 2020), Aila was a classic baroclinic storm (Rantanen et al. 2021). What was remarkable in Mauri was that its maximum 10-min average storm winds (23 m/s) were reported from land areas and not from the sea as for Aila. However, it must be noted that there were much less wind speed observations in 1982 than in 2020 and therefore it is possible that the strongest winds in Mauri were not reported. Typically, severe windstorms occur during late autumn and winter, e.g., Storm Laina (2/2015) and Storm Seija (12/2013). Nonetheless, it is important to note that the storm impacts do not only depend on the wind speed but also for example ground frost and affected areas have an important role. The impacts of Storm Aila are discussed in another article in this Research Letter issue (Láng et al. 2021).
Observed storm day statistics. Storm day in Finland is defined as a day with observed 10-min average wind speed equal to or higher than 21 m/s on at least one of the coastal weather stations. During 2020, Finland experienced 44 storm days which is the highest annual number of storm days in the period of 2006–2020 (FMI 2021). The second highest annual number of storm days was 37 in 2007 and the annual average of storm days is 27 for the period of 2006–2020 (FMI 2021).
Discussion on climate change. The risk for windstorm impacts on Finland is increasing based on several factors: 1) decrease of soil frost during winter, 2) Norway spruce being the most vulnerable tree species for windthrow without soil frost, 3) leaves on trees in summer and autumn adding the wind load for deciduous trees as birch is taking over Norway spruce in south (Peltola et al. 2010), 4) snow loads on branches of the coniferous trees in autumn, winter and spring (Gregow et al. 2011 and references therein). As regards the impact of climate change on strong winds one needs to be careful when assessing variability and trends, because the chosen time period from which the trend is calculated has a significant effect on the magnitude and sign of the trend. Based on Gregow et al. (2008), when investigating the variability of the strength of the storms (with respect to the observed 10-min mean wind speeds) in Finland, one could see, based on four stations, that there was decadal variation but no significant trend in the frequency of storms in 1959–2007. Similarly, Laurila et al. (2021) found no significant trends for mean and extreme 10-meter wind speeds in Finland from ERA5 reanalysis (gridded wind speeds) in 1979–2018.
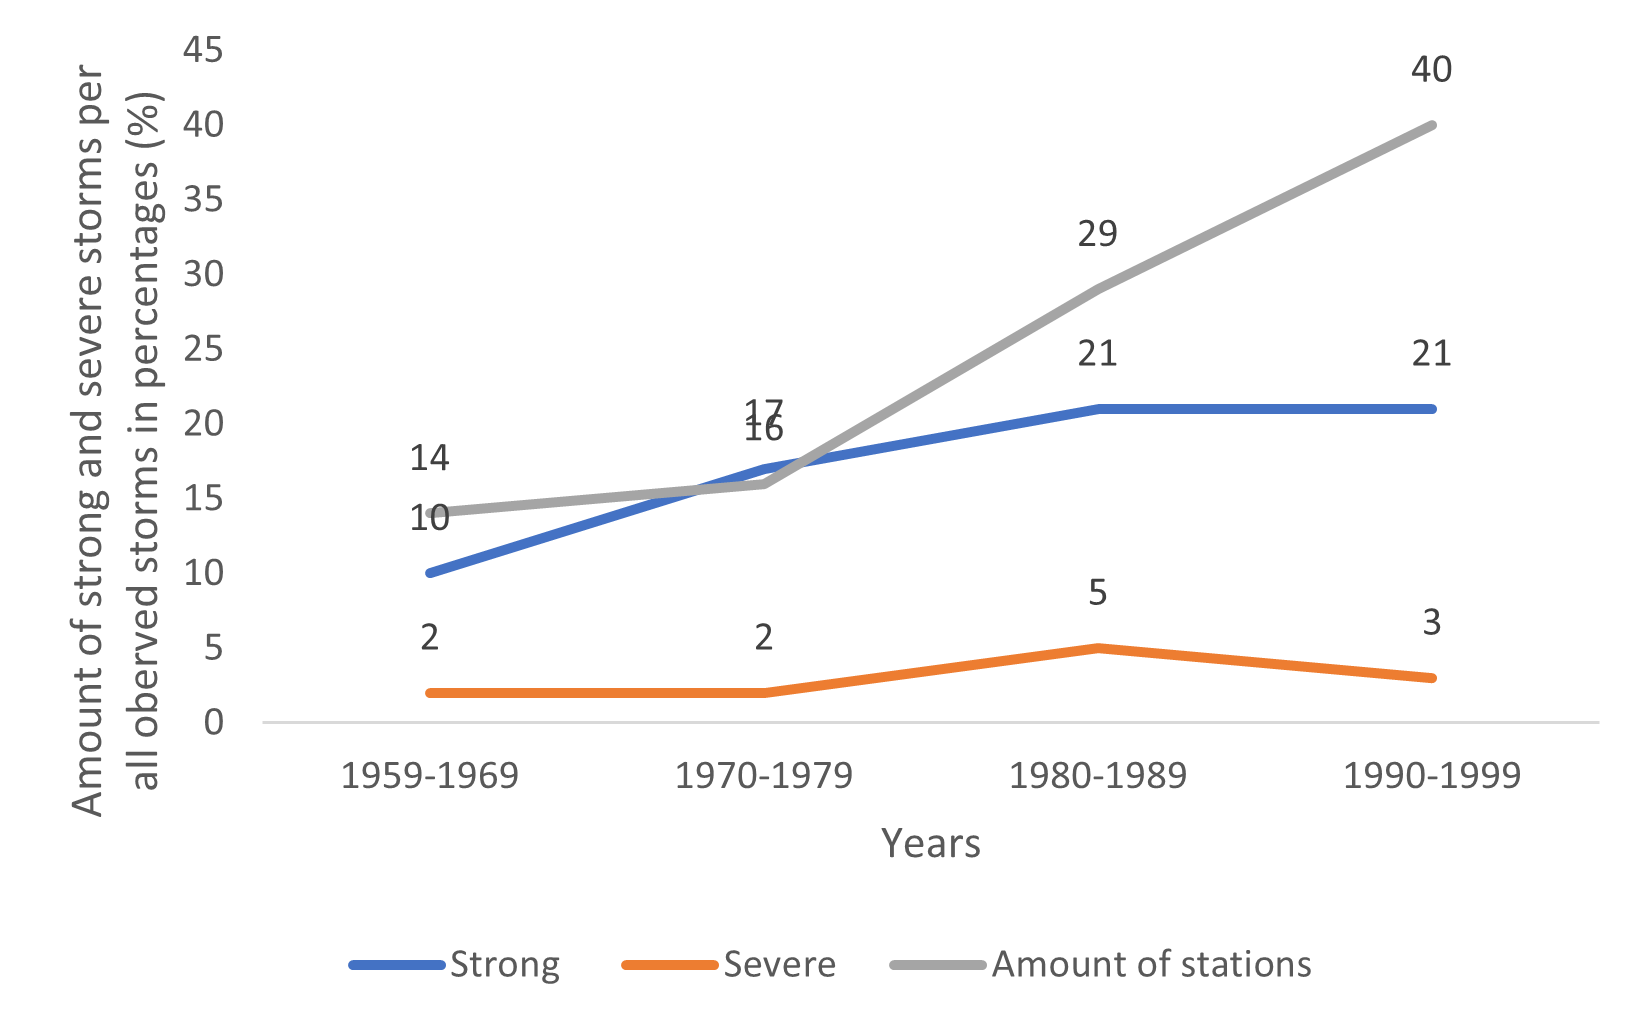
The other investigations in Gregow et al. (2008) focused on the historical severity classification of windstorms (covering decades 1959–1999). The increase in the number of measurement stations was also considered. A storm was ranked strong or severe if, correspondingly, 25–27.9 m/s and 28 m/s or more was measured during the storm by at least one Finnish coastal station. It was found that in 1959–1969 out of 94 observed windstorms (OW), altogether (9) 10 % were strong and (2) 2 % were severe (Fig. 4). In 1970–1979, out of 143 OW altogether (24) 17 % were strong and (3) 2 % were severe (Fig. 4). In 1980–1989, out of 158 OW, altogether (33) 21 % were strong and (8) 5 % were severe and in 1990–1999, out of 205 OW altogether (44) 21 % were strong and (7) 3 % severe (Fig. 4). Gregow et al. (2008) noticed that the number of storms increased as the measurement network got denser (Fig. 4). The decadal assessments were conducted to see whether there was a predictable decadal variation in the occurrence of strong and severe storms and if there was a change in the spatial extent of the storms impacting Finnish territories.
As regards the future, there is little agreement on how the windiness is going to change in Finland during the 21st century, because of the existing large uncertainties in the response of atmospheric circulation to anthropogenic climate change (Gregow et al. 2020). For example, based on 21 Coupled Model Intercomparison Project Phase 5 (CMIP5) climate models, only minor changes in the strong winds are expected in Finland (Ruosteenoja et al. 2019): the change for September, October and November in Finland and its surroundings is 0–2.5 % by the end of the 21st century. Moreover, this result was obtained using Representative Concentration Pathway 8.5 (RCP8.5) scenario, which is nowadays considered as an unlikely, worst-case scenario (Hausfather and Peters 2020). With a more realistic, RCP4.5 scenario, the future changes in wind speeds in autumn were found to be even weaker (Ruosteenoja et al. 2019).
Aila was the strongest windstorm recorded in Finland for the month of September with the present-day network of observation stations (Rantanen et al. 2021). However, as Gregow et al. (2008) showed, the denser the measuring network, the better we can assess the details with respect to the number and severity of storms. Thus, the direct comparison to the storm records of previous years must be done with caution.
While many future studies on windiness have estimated the time-mean changes of strong winds under the anthropogenic climate change (e.g. Ruosteenoja et al. 2019), more information on the behaviour of extreme winds associated with windstorms, such as Aila, could be potentially obtained by extracting and analysing the wind speeds along the cyclone tracks in climate model simulations (e.g. Priestley et al. 2020). This would give knowledge on how the extreme winds specifically in the mid-latitude cyclones are possibly going to change in the future, which is crucial information when assessing how to adapt to climate change. Thus, although Aila made a new record for September, we emphasize that further research is needed to investigate whether severe windstorms in autumn such as Aila are becoming more common in the future.
Acknowledgement: We thank ERA4CS for the Windsurfer project. And we thank Antti Mäkelä for proof-reading.
References
Bengtsson, L., et al., 2017: The HARMONIE–AROME Model Configuration in the ALADIN–HIRLAM NWP System. Mon. Weather Rev., 145, 1919–1935, https://doi.org/10.1175/MWR-D-16-0417.1.
FMI, 2021: Tuulitilastot. Accessed 14 April 2021, https://www.ilmatieteenlaitos.fi/tuulitilastot.
Gregow, H., et al., 2008: Vaaraa aiheuttavista sääilmiöistä Suomen muuttuvassa ilmastossa. Raportteja 2008:3. Ilmatieteen laitos, 99 s.
Gregow, H., et al., 2020: Review on winds, extratropical cyclones and their impacts in Northern Europe and Finland, Finnish Meteorological Institute Reports, 2020(3), http://hdl.handle.net/10138/320298.
Gregow, H., et al., 2011: Combined occurrence of wind, snow loading and soil frost with implications for risks to forestry in Finland under the current and changing climatic conditions, Silva Fenn., 45, 35–54, https://doi.org/10.14214/sf.30.
Hausfather, Z. and Peters, G., 2020: Emissions–the ‘business as usual’ story is misleading, Nature, 577, 618–620, https://doi.org/10.1038/d41586-020-00177-3.
Láng, I., et al., 2021: Windstorm Aila 2020: Societal Impacts, FMI’s Clim. Bull. Res. Lett., [preprint],
https://doi.org/10.35614/ISSN-2341-6408-IK-2021-05-RL.
Laurila, T. K., et al., 2020: The Extratropical Transition of Hurricane Debby (1982) and the Subsequent Development of an Intense Windstorm over Finland, Mon. Weather Rev., 148, 377–401, https://doi.org/10.1175/MWR-D-19-0035.1.
Laurila, T. K., et al., 2021: Climatology, variability, and trends in near‐surface wind speeds over the North Atlantic and Europe during 1979–2018 based on ERA5, Int. J. Climatol., 41(4), 2253–2278, https://doi.org/10.1002/joc.6957.
Peltola, H., et al., 2010: Impacts of climate change on timber production and regional risks of wind-induced damage to forests in Finland, For. Ecol. and Manag., 260(5), 833–845.
Priestley, M. D. K., et al., 2020: An Overview of the Extratropical Storm Tracks in CMIP6 Historical Simulations, J. Climate, 33(15), 6315–6343, https://doi.org/10.1175/JCLI-D-19-0928.1.
Rantanen, M., et al., 2021: Storm Aila: An unusually strong autumn storm in Finland, Weather, https://doi.org/10.1002/wea.3943.
Ruosteenoja, K. et al., 2019: Projected changes in European and North Atlantic seasonal wind climate derived from CMIP5 simulations, J. Climate, 32(19), 6467–6490, https://doi.org/10.1175/JCLI-D-19-0023.1
HOW TO CITE THIS ARTICLE:
Gregow H., Laurila T. K., Rantanen M., Saarikalle E., Láng I., and Fortelius C., 2021: Windstorm Aila 2020: wind forecasts and discussion on climate change, FMI’s Climate Bulletin: Research Letters, 3(1), 11–14, DOI: https://doi.org/10.35614/ISSN-2341-6408-IK-2021-04-RL
CITATION INFORMATION:
Authors: Hilppa Gregow, Terhi K. Laurila, Mika Rantanen, Eerik Saarikalle, Ilona Láng, and Carl Fortelius
Received: September 22, 2020
Accepted: May 11, 2021
First online: May 25, 2021
Published: June 24, 2021
Journal: FMI’s Climate Bulletin: Research Letters
Volume: 3
Issue: 1
Pages: 11–14
DOI: https://doi.org/10.35614/ISSN-2341-6408-IK-2021-04-RL
Header image: Abobe Stock