Historical time series of occurrence of thunderstorms in Finland reveals a large year-to-year variation. On average, there are annually 134 000 cloud-to-ground flashes in Finland.
TERHI K. LAURILA, ANTTI MÄKELÄ
Finnish Meteorological Institute
Thunderstorms and related phenomena, such as lightning, wind gusts and heavy rainfall, can lead to considerable damage, economic losses and even cause fatalities. Therefore, the research of thunderstorms is important not only from meteorological perspective but also for the safety and preparedness of the society.
In Finland, thunderstorm observations have been recorded since 1887 when human observations of thunder days were started. An automatic flash counter network was established in 1960 which enabled the detection of the number of cloud-to-ground flashes. Since the lightning location system became operative at Finnish Meteorological Institute in 1998, also the lightning strike point and other lightning statistics have been recorded (Mäkelä et al. 2010). Hence, currently there are 132 years of thunder day observations and 59 years of flash number observations to investigate the long-term occurrence of thunderstorms in Finland. For more details on the observations, see Tuomi and Mäkelä (2008) and Mäkelä et al. (2010).
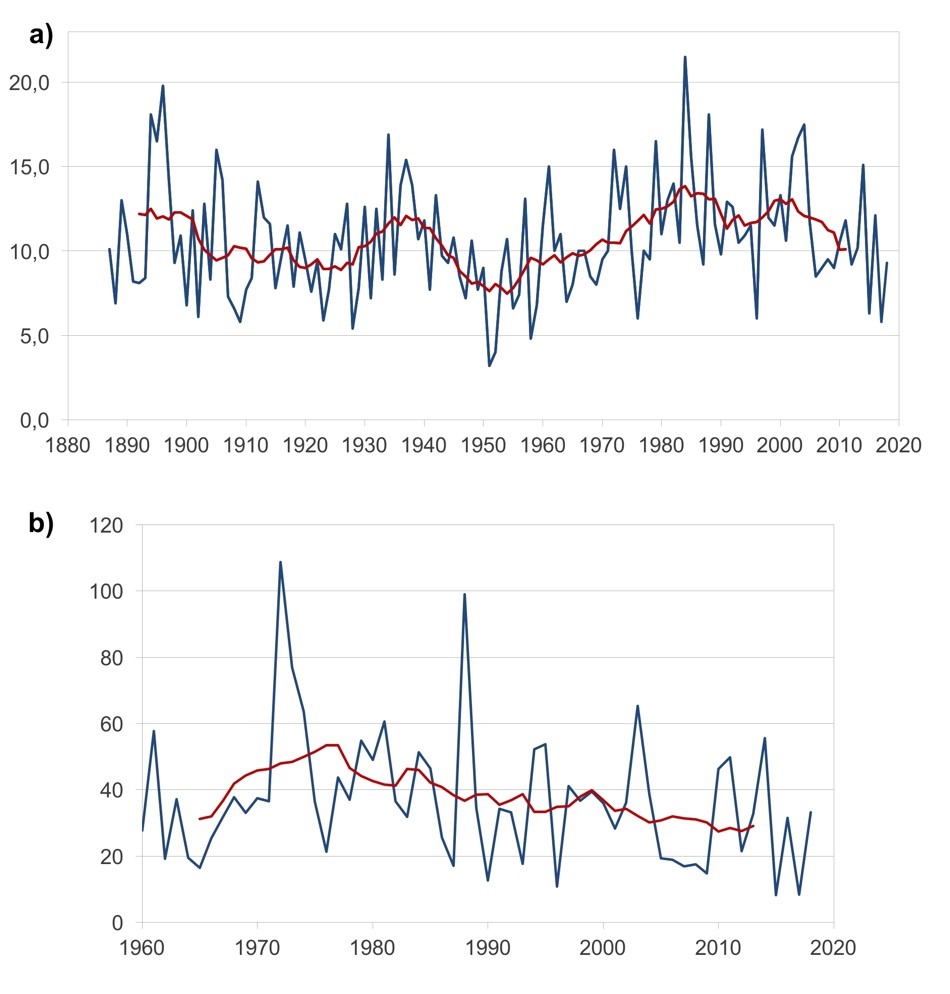
A thunder day is defined as a day when lightning is observed in an observation site. Time series of thunder days show a large annual and decadal variation (Fig. 1a). High-activity periods occurred, for example, during 1934–1940 and 1984–1988. In contrast, years 1950–1955 had low activity in thunder days. There is no clear trend in the long-term variation; however, there seems to be a periodicity in the high and low thunderstorm activity years. The average annual number of thunder days for the period 1887–2018 in Finland was 10,7.
Annual number of cloud-to-ground flashes in Finland has also a large annual variation (Fig. 1b). The years with the highest annual amount of lightning were 1972, 1988 and 2003 whereas the lowest number of flashes occurred in 1996, 2015 and 2017. On average, there are annually 134 000 cloud-to-ground flashes in Finland, and the average annual flash density is 0,37 km-2 yr-1. It should be noted that even during the years of low lightning activity, individual thunderstorms may have reached high intensity; in fact, typically a major part of annual lightning in Finland is from a few intense thunderstorm days.
References
Mäkelä, A., et al., 2010: A decade of high-latitude lightning location: Effects of the evolving location network in Finland, Journal of Geophysical Research: Atmospheres, 115(D21), DOI: 10.1029/2009JD012183
Tuomi, T.J., and Mäkelä A., 2008: Thunderstorm climate of Finland 1998–2007, Geophysica, 44(1–2), 67–80.
HOW TO CITE THIS ARTICLE:
Laurila T. K., and Mäkelä A., 2019: Thunderstorm observations in Finland – historical observations since 1887, FMI’s Climate Bulletin: Research Letters, 1(2), 4, DOI: 10.35614/ISSN-2341-6408-IK-2019-13-RL
CITATION INFORMATION:
Authors: Terhi K. Laurila and Antti Mäkelä
Received: September 10, 2019
Accepted: December 13, 2019
First online: December 19, 2019
Journal: FMI’s Climate Bulletin: Research Letters
Volume: 1
Issue: 2
Page: 4
DOI: 10.35614/ISSN-2341-6408-IK-2019-13-RL
Header image: Anne Saarinen