The beginning and ending of the prolonged heat wave in mid-summer 2018 was predicted by the ECMWF ensemble forecasts 12-18 days in advance.
NATALIA KORHONEN, OTTO HYVÄRINEN, REIJA RUUHELA, ANNA LUOMARANTA, HILPPA GREGOW
Finnish Meteorological Institute
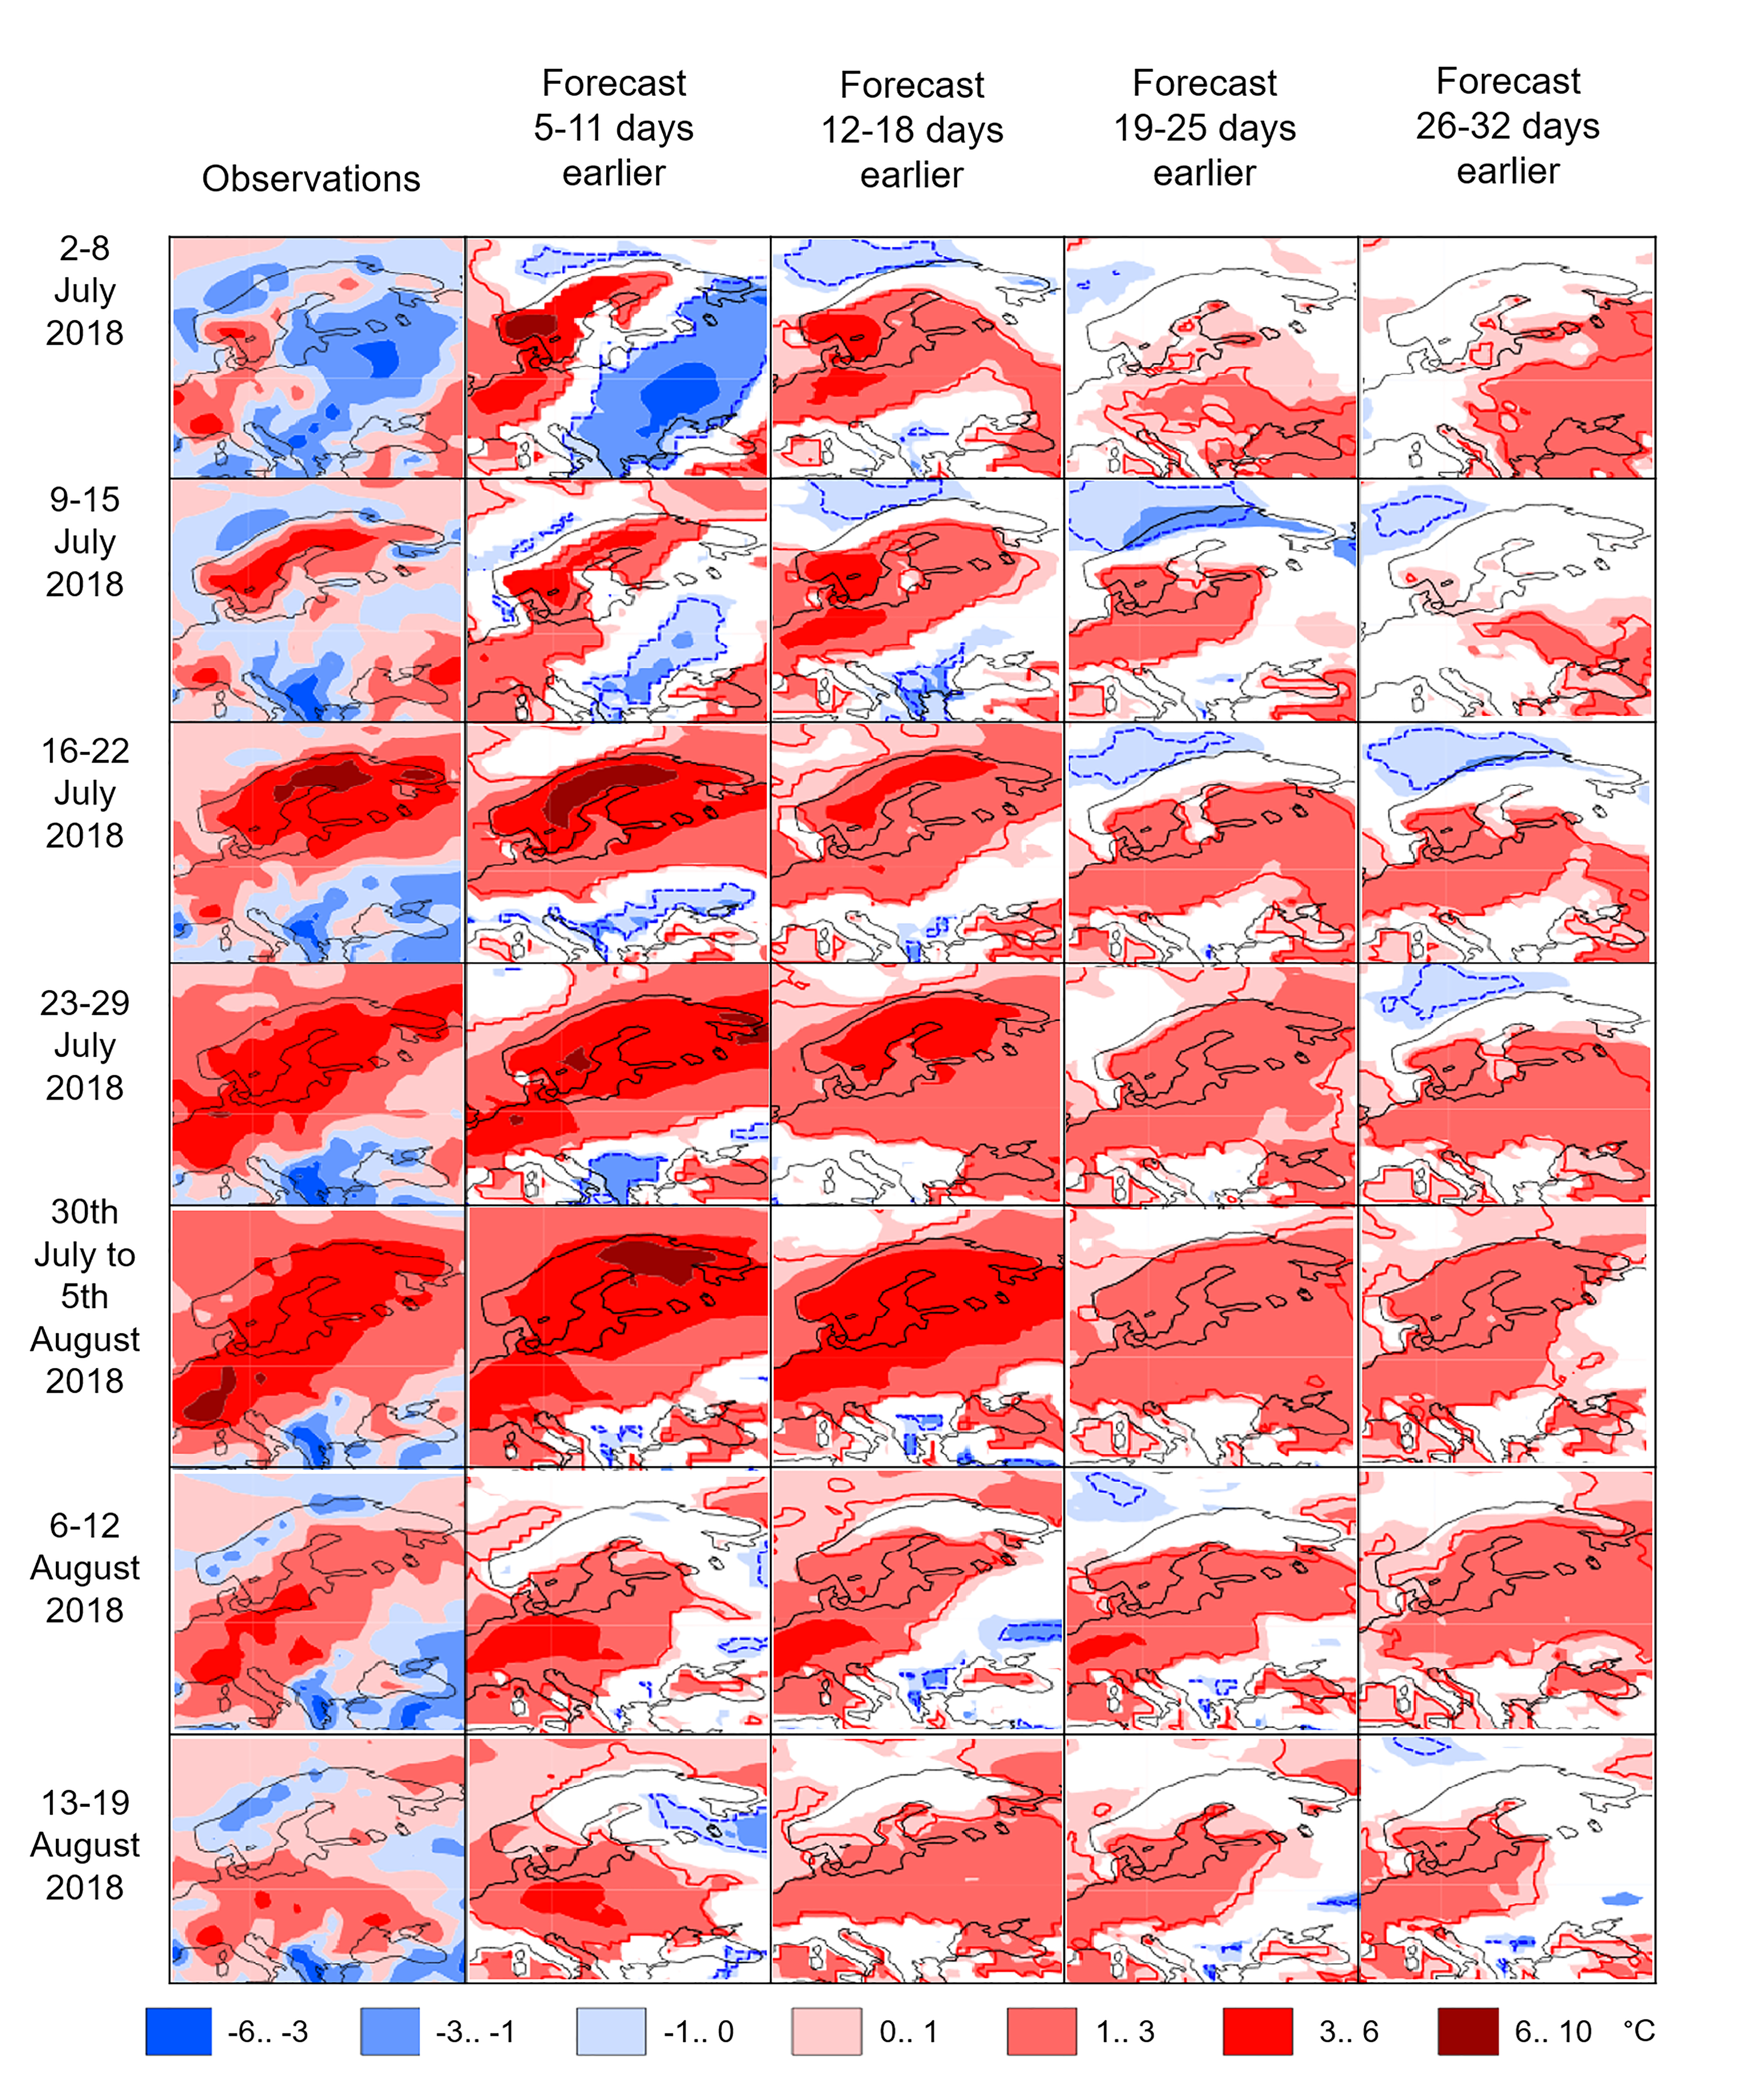
In summer 2018, prolonged heat waves in many areas around the Northern Hemisphere led to record-breaking temperatures, severe droughts, crop failures, and forest fires (WMO, 2018). In Fennoscandia, the dry and warm May 2018, was followed by a prolonged heat wave between 9th July and 12th August 2018, during which the weekly mean temperatures were mostly 1-6 degrees above average as depicted in Fig. 1, first column. The National Institute for Health and Welfare (THL) estimated that the heat wave caused 380 excess deaths (THL, 2018).
The heat waves in summer 2018 were in part caused by the weaker than average jet stream causing stationary high pressure systems. Further, it has been estimated that global warming more than doubled the probability of this heat wave to occur in many places in northern Europe (Otto, 2016; Schiermeier, 2018).
In Fig. 1 columns 2-5 show the weekly mean temperature outlooks by the monthly ensemble forecast of the European Centre for Medium-Range Weather Forecasts (ECMWF; Molteni et al., 2011). These ECMWF forecasts predicted both the beginning and the ending of higher than usual weekly mean temperatures during the heat wave about 12-18 days in advance. Further, for the mature phase of the heat wave (time period 30th July to 12th August), the forecasts succeeded in predicting the persistence of higher than usual weekly mean temperatures as much as 26-32 days in advance.
Acknowledgements: We thank ECMWF and the Academy of Finland (project number 303951, SA CLIPS) for their support.
References
Molteni, F., and Coauthors, 2011: The new ECMWF seasonal forecast system (System 4). ECMWF Tech. Memo. 656, 49 p.
National Institute for Health and Welfare (THL), 2018: Viime kesän helleaalto lisäsi ikääntyneiden kuolleisuutta – helteisiin on hyvä varautua ajoissa
Otto, F.E.L., 2016: The art of attribution, Nature Climate Change, 6, p. 342–343.
Schiermeier, Q. 2018: Droughts, heatwaves and floods: How to tell when climate change is to blame. Nature, 560, p. 20–22.
World Meteorological Organization (WMO), 2018: July sees extreme weather with high impacts
HOW TO CITE THIS ARTICLE:
Korhonen N., Hyvärinen O., Ruuhela R., Luomaranta A., and Gregow H., 2019: The ECMWF monthly forecast predicted the Finnish heat wave in summer 2018, FMI’s Climate Bulletin: Research Letters, 1(1), 4, DOI: 10.35614/ISSN-2341-6408-IK-2019-02-RL
CITATION INFORMATION:
Authors: Natalia Korhonen, Otto Hyvärinen, Reija Ruuhela, Anna Luomaranta, and Hilppa Gregow
Received: March 28, 2019
Accepted: June 11, 2019
First online: June 19, 2019
Published: June 20, 2019
Journal: FMI’s Climate Bulletin: Research Letters
Volume: 1
Issue: 1
Page: 4
DOI: 10.35614/ISSN-2341-6408-IK-2019-02-RL
Header image: Eija Vallinheimo